“Extreme Weather” Page
Tropical Cyclones
Global Tropical Cyclone Accumulated Cyclone Energy (ACE) – 1971 to Present
y - 1971 to Presentt") Global Tropical Cyclone Frequency- 1971 to Present
Global Tropical Cyclone Frequency- 1971 to Present
 Global Hurricane Frequency – 1978 to Present
 Number of Atlantic Hurricanes
 Number of Named Atlantic Storms
 US Extremes in Landfalling Tropical Systems – 1910 to Present – Annual
 US Hurricanes 1851 – 2010
 Australian Region Tropical Cyclones 1970–2011 (Severe tropical
cyclones are those which show a minimum central pressure less than 970
hPa)
Australian Region Tropical Cyclones 1970–2011 (Severe tropical
cyclones are those which show a minimum central pressure less than 970
hPa)
 Tornadoes
Note: The US represents about 75 percent of the world’s recorded tornadoes:
US Inflation Adjusted Annual Tornado Trend and Percentile Ranks
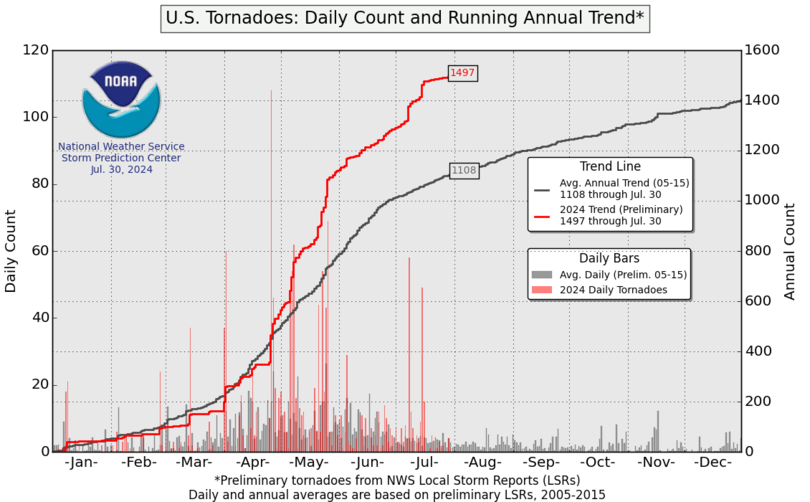
 Preliminary U.S. Daily Count and Running Annual Tornado Trend From National Weather Services Local Storm Reports
 US Strong to Violent Tornadoes (EF3-EF5*) – 1950 to Present
 U.S. Tornadoes (EF1-EF5) – Annual Count 1954 – 2012
 Precipitation/Drought
Global Precipitation 1901 – 2009
 Note: The United States (US) represents less than 2% of Earth’s surface area and the contiguous U.S. “is just “1.58% of the total surface area of the Earth” .
US Average Streamflow Index – 1999 to Present
 Contiguous US – Precipitation 1901 – 2009
 US Extremes in 1-Day Precipitation – 1910 to Present – Year to Date
 Contiguous US – Extreme One-Day Precipitation Events 1901 – 2009
 Contiguous US – Abnormally High Annual Precipitation 1895 – 2008
 Extremes in Days with/without Precipitation – 1910 to Present – Year to Date
 Global Palmer Drought Severity Index (PDSI) – 1950 – 2010
 Extremes in Palmer Drought Severity Index (PDSI) – 1910 to Present – Year to Date
 - 1910 to Present - Year to Date") Contiguous US – Palmer Z Index – 1998 – 2011
Contiguous US – Palmer Z Index – 1998 – 2011
 US Lands Under Drought Conditions 2000 – 2009
 Percent of US in Moderate to Extreme Drought 1900 – 2006
 US and North American Drought Comparison
 Prairie Provinces (Alberta, Saskatchewan, and Manitoba Canada) Drought Frequency and Severity – 1402 to 2002
 Drought Frequency and Severity - 1402 to 2002") Temperature
Temperature
US Annual Heat Wave Index 1895 – 2008
 Contiguous US – Hot Daily High Temperatures 1910 – 2008
 Contiguous US – Hot Daily Low Temperatures 1920 – 2008
 Extremes in Minimum Temperature – 1910 to Present
 Extremes in Maximum Temperature – 1910 to Present
 Central Europe Pressure – Temperature – Precipitation
 Snowfall
Northern Hemisphere Winter Snow Cover – 1967 to Present
 Eurasian Winter Snow Cover – 1967 to Present
 Northern Hemisphere Snowcover with 1995 – 2009 Climatology
 5 Year Northern Hemisphere Snowcover with 1995 – 2009 Climatology
 10 Year Northern Hemisphere Snowcover with 1995 – 2009 Climatology
 20 Year Northern Hemisphere Snowcover with 1995 – 2009 Climatology
 Western Slope Sierra Snowfall Average – 1979 – Present
 Central Sierra Donner Summit Snowfall and Snowpack 1879 – 2011
 Source Guide
Australian Bureau of Meteorology (BOM):
Home Page – http://www.bom.gov.au/
Climate Page – http://www.bom.gov.au/climate/
ENSO Page – http://www.bom.gov.au/climate/enso/
Florida State University – Department of Earth, Ocean, and Atmospheric Science – Moe – Robert Hart, PhD.
Home Page – http://moe.met.fsu.edu/
Products Page – http://moe.met.fsu.edu/~rhart/web.php
Environmental Protection Agency (EPA)
Home Page – http://epa.gov/
Indicators Page – http://www.epa.gov/climatechange/science/indicators/
IPCC’s Special Report Managing the Risks of Extreme Events and Disasters to Advance Climate Change
Adaptation (SREX):
Home Page – http://www.ipcc-wg2.gov/SREX/
Summary For Policymakers – http://www.ipcc-wg2.gov/SREX/images/uploads/SREX-SPMbrochure_FINAL.pdf
Full Report – http://www.ipcc-wg2.gov/SREX/images/uploads/SREX-All_FINAL.pdf
John Christy, Director of the Earth System Science Center at the University of Alabama in Huntsville
Home Page – http://www.nsstc.uah.edu/atmos/christy2011/index.html
Press Release – http://nsstc.uah.edu/essnews/stories/02142012.html
Justin Sheffield, Eric F. Wood & Michael L. Roderick – Little change in global drought over the past 60 years – Nature
Paper – http://www.nature.com/nature/journal/v491/n7424/full/nature11575.html
National Oceanic and Atmospheric Administration (NOAA) – National Climatic Data Center (NCDC)
Home Page – http://www.ncdc.noaa.gov/oa/about/about.html?bandwidth=high
Products Page – http://www.ncdc.noaa.govgov/oa/ncdc.html?bandwidth=high
FTP Page – http://www1.ncdc.noaa.gov/pub/data/cmb/?bandwidth=high
National Oceanic and Atmospheric Administration (NOAA) – Storm Prediction Center (SPC)
Home Page – http://www.spc.noaa.gov/
Tornado Page – http://www.spc.noaa.gov/climo/online/monthly/newm.html
Reinhard Böhm – Austrian Central Administration For Meteorology (ZAMG)
Paper – http://resources.metapress.com/pdf-preview.axd?code=l446053m40t06j43&size=largest
Rutgers University – Global Snow Lab (GSL)
Home Page – http://climate.rutgers.edu/snowcover/index.php?bandwidth=high
Products Page – http://climate.rutgers.edu/snowcover/chart_seasonal.php?ui_set=eurasia&ui_season=1?bandwidth=high
Roger Pielke, Jr. – University of Colorado at Boulder.
Home Page – http://rogerpielkejr.blogspot.ca/
Drought Article – http://rogerpielkejr.blogspot.ca/2012/09/drought-and-climate-change.html
Disaster Bullshit Button – http://rogerpielkejr.blogspot.ca/2012/03/handy-bullshit-button-on-disasters-and.html
Ryan N. Maue – PoliClimate.com
Home Page – http://policlimate.com/weather/
SaskAdapt – The Prairie Adaptation Research Collaborative at the University of Regina
Home Page – http://www.parc.ca/saskadapt/
Water & Drought – http://www.parc.ca/saskadapt/adaptation-options/theme-assessments/water-drought
WeatherStreet.com
Home Page – http://www.weatherstreet.com/
Steven Goddard – RealSecience.com
Home Page – http://stevengoddard.wordpress.com/
Bad Weather Page – http://stevengoddard.wordpress.com/bad-weather/
University of California, Berkeley – Central Sierra Snow Laboratory
Home Page – http://vcresearch.berkeley.edu/research-unit/central-sierra-snow-lab
Snowfall – http://www.thestormking.com/Weather/Sierra_Snowfall/sierra_snowfall.html
U.S. Geological Survey (USGS) – WaterWatch
Home Page – http://waterwatch.usgs.gov/new/?bandwidth=high
Additional Research
Anthony Watts – WattsUpWithThat.com
“See also my compilation of extreme weather trends (not).”
Floods – no increase in frequency, less intense
Extreme weather events – no trend
Global precipitation – no trends
Rate of sea level rise – deceleration over 80 years
Weird weather – no trends
Forest fires – decreasing frequency
Tropical Pacific sea level rise – fell
Philippe Sorrel, Maxime Debret, Isabelle Billeaud, Samuel L. Jaccard, Jerry F. McManus & Bernadette Tessier – “Persistent non-solar forcing of Holocene storm dynamics in coastal sedimentary archives” – Nature:
Paper – http://www.nature.com/ngeo/journal/vaop/ncurrent/full/ngeo1619.html#ref1
“Here we present a reappraisal of high-energy estuarine and coastal sedimentary records from the southern coast of the English Channel, and report evidence for five distinct periods during the Holocene when storminess was enhanced during the past 6,500 years. We find that high storm activity occurred periodically with a frequency of about 1,500 years, closely related to cold and windy periods diagnosed earlier. We show that millennial-scale storm extremes in northern Europe are phase-locked with the period of internal ocean variability in the North Atlantic of about 1,500 years.”
A.D. Erlykina, B.A. Lakenb and A.W. Wolfendalea – Fluctuations in some climate parameters – Journal of Atmospheric and Solar-Terrestrial Physics:
Paper – http://www.sciencedirect.com/science/article/pii/S1364682611000319
“There is argument as to the extent to which there has been an increase over the past few decades in the frequency of the extremes of climatic parameters, such as temperature, storminess, precipitation, etc, an obvious point being that Global Warming might be responsible. Here we report results on those parameters of which we have had experience during the last few years: Global surface temperature, Cloud Cover and the MODIS Liquid Cloud Fraction. In no case we have found indications that fluctuations of these parameters have increased with time.”
Global Tropical Cyclone Accumulated Cyclone Energy (ACE) – 1971 to Present
y - 1971 to Presentt")
Ryan N. Maue PhD – PoliClimate.com – Click the pic to view at source

Ryan N. Maue PhD – PoliClimate.com – Click the pic to view at source

Ryan N. Maue PhD – PoliClimate.com – Click the pic to view at source

Ryan N. Maue PhD – WeatherStreet.com – Click the pic to view at source

Ryan N. Maue PhD – WeatherStreet.com – Click the pic to view at source

National Oceanic and Atmospheric Administration (NOAA) – National Climatic Data Center (NCDC) – Click the pic to view at source

National
Oceanic and Atmospheric Administration (NOAA) – Atlantic Oceanographic
and Meteorological Laboratory – (AOML) – Click the pic to view at source

Australian Bureau of Meteorology (BOM) – Click the pic to view at source
Note: The US represents about 75 percent of the world’s recorded tornadoes:
US Inflation Adjusted Annual Tornado Trend and Percentile Ranks

National Oceanic and Atmospheric Administration (NOAA) – Storm Prediction Center- Click the pic to view at source
National Oceanic and Atmospheric Administration (NOAA) – Storm Prediction Center – Click the pic to view at source

National Oceanic and Atmospheric Administration (NOAA) – National Climatic Data Center (NCDC) – Click the pic to view at source

National Oceanic and Atmospheric Administration (NOAA) – National Climatic Data Center (NCDC) – Click the pic to view at source
Global Precipitation 1901 – 2009

Environmental Protection Agency (EPA) – Click the pic to view at source
US Average Streamflow Index – 1999 to Present

U.S. Geological Survey (USGS) – WaterWatch – Click the pic to view at source

Environmental Protection Agency (EPA) – Click the pic to view at source

National Oceanic and Atmospheric Administration (NOAA) – National Climatic Data Center (NCDC) – Click the pic to view at source

Environmental Protection Agency (EPA) – Click the pic to view at source

Environmental Protection Agency (EPA) – Click the pic to view at source

National Oceanic and Atmospheric Administration (NOAA) – National Climatic Data Center (NCDC) – Click the pic to view at source
Justin
Sheffield, Eric F. Wood & Michael L. Roderick – Little change in
global drought over the past 60 years – Nature – Click the pic to view
at source
 - 1910 to Present - Year to Date")
National Oceanic and Atmospheric Administration (NOAA) – National Climatic Data Center (NCDC) – Click the pic to viewat source

National Oceanic and Atmospheric Administration (NOAA) – National Climatic Data Center (NCDC) – Click the pic to viewat source

Environmental Protection Agency (EPA) – Click the pic to view at source

Karl, T., NOAA. 2006. – Click the pic to view at source

Roger Pielke, Jr. – University of Colorado at Boulder. – Click the pic to view at source
 Drought Frequency and Severity - 1402 to 2002")
SaskAdapt – the Prairie Adaptation Research Collaborative at the University of Regina – Click the pic to view at source
US Annual Heat Wave Index 1895 – 2008

Environmental Protection Agency (EPA) – Click the pic to view at source

Environmental Protection Agency (EPA) – Click the pic to view at source

Environmental Protection Agency (EPA) – Click the pic to view at source

National Oceanic and Atmospheric Administration (NOAA) – National Climatic Data Center (NCDC) – Click the pic to view at source

National Oceanic and Atmospheric Administration (NOAA) – National Climatic Data Center (NCDC) – Click the pic to view at source
Reinhard Böhm – Austrian Central Administration For Meteorology (ZAMG) – Click the pic to view at source
Northern Hemisphere Winter Snow Cover – 1967 to Present

Rutgers University – Global Snow Lab (GSL) – Click the pic to view at source

Rutgers University – Global Snow Lab (GSL) – Click the pic to view at source

Department of Earth, Ocean, and Atmospheric Science – Florida State University – Click the pic to view at source

Florida State University – Department of Earth, Ocean, and Atmospheric Science – Click the pic to view at source

Florida State University – Department of Earth, Ocean, and Atmospheric Science – Click the pic to view at source

Florida State University – Department of Earth, Ocean, and Atmospheric Science – Click the pic to view at source
John
Christy, Director of the Earth System Science Center at the University
of Alabama in Huntsville – Click the pic to view at source

University of California, Berkeley – Central Sierra Snow Laboratory – Click the pic to view at source
Australian Bureau of Meteorology (BOM):
Home Page – http://www.bom.gov.au/
Climate Page – http://www.bom.gov.au/climate/
ENSO Page – http://www.bom.gov.au/climate/enso/
Florida State University – Department of Earth, Ocean, and Atmospheric Science – Moe – Robert Hart, PhD.
Home Page – http://moe.met.fsu.edu/
Products Page – http://moe.met.fsu.edu/~rhart/web.php
Environmental Protection Agency (EPA)
Home Page – http://epa.gov/
Indicators Page – http://www.epa.gov/climatechange/science/indicators/
IPCC’s Special Report Managing the Risks of Extreme Events and Disasters to Advance Climate Change
Adaptation (SREX):
Home Page – http://www.ipcc-wg2.gov/SREX/
Summary For Policymakers – http://www.ipcc-wg2.gov/SREX/images/uploads/SREX-SPMbrochure_FINAL.pdf
Full Report – http://www.ipcc-wg2.gov/SREX/images/uploads/SREX-All_FINAL.pdf
John Christy, Director of the Earth System Science Center at the University of Alabama in Huntsville
Home Page – http://www.nsstc.uah.edu/atmos/christy2011/index.html
Press Release – http://nsstc.uah.edu/essnews/stories/02142012.html
Justin Sheffield, Eric F. Wood & Michael L. Roderick – Little change in global drought over the past 60 years – Nature
Paper – http://www.nature.com/nature/journal/v491/n7424/full/nature11575.html
National Oceanic and Atmospheric Administration (NOAA) – National Climatic Data Center (NCDC)
Home Page – http://www.ncdc.noaa.gov/oa/about/about.html?bandwidth=high
Products Page – http://www.ncdc.noaa.govgov/oa/ncdc.html?bandwidth=high
FTP Page – http://www1.ncdc.noaa.gov/pub/data/cmb/?bandwidth=high
National Oceanic and Atmospheric Administration (NOAA) – Storm Prediction Center (SPC)
Home Page – http://www.spc.noaa.gov/
Tornado Page – http://www.spc.noaa.gov/climo/online/monthly/newm.html
Reinhard Böhm – Austrian Central Administration For Meteorology (ZAMG)
Paper – http://resources.metapress.com/pdf-preview.axd?code=l446053m40t06j43&size=largest
Rutgers University – Global Snow Lab (GSL)
Home Page – http://climate.rutgers.edu/snowcover/index.php?bandwidth=high
Products Page – http://climate.rutgers.edu/snowcover/chart_seasonal.php?ui_set=eurasia&ui_season=1?bandwidth=high
Roger Pielke, Jr. – University of Colorado at Boulder.
Home Page – http://rogerpielkejr.blogspot.ca/
Drought Article – http://rogerpielkejr.blogspot.ca/2012/09/drought-and-climate-change.html
Disaster Bullshit Button – http://rogerpielkejr.blogspot.ca/2012/03/handy-bullshit-button-on-disasters-and.html
Ryan N. Maue – PoliClimate.com
Home Page – http://policlimate.com/weather/
SaskAdapt – The Prairie Adaptation Research Collaborative at the University of Regina
Home Page – http://www.parc.ca/saskadapt/
Water & Drought – http://www.parc.ca/saskadapt/adaptation-options/theme-assessments/water-drought
WeatherStreet.com
Home Page – http://www.weatherstreet.com/
Steven Goddard – RealSecience.com
Home Page – http://stevengoddard.wordpress.com/
Bad Weather Page – http://stevengoddard.wordpress.com/bad-weather/
University of California, Berkeley – Central Sierra Snow Laboratory
Home Page – http://vcresearch.berkeley.edu/research-unit/central-sierra-snow-lab
Snowfall – http://www.thestormking.com/Weather/Sierra_Snowfall/sierra_snowfall.html
U.S. Geological Survey (USGS) – WaterWatch
Home Page – http://waterwatch.usgs.gov/new/?bandwidth=high
Additional Research
Anthony Watts – WattsUpWithThat.com
“See also my compilation of extreme weather trends (not).”
Floods – no increase in frequency, less intense
Extreme weather events – no trend
Global precipitation – no trends
Rate of sea level rise – deceleration over 80 years
Weird weather – no trends
Forest fires – decreasing frequency
Tropical Pacific sea level rise – fell
Philippe Sorrel, Maxime Debret, Isabelle Billeaud, Samuel L. Jaccard, Jerry F. McManus & Bernadette Tessier – “Persistent non-solar forcing of Holocene storm dynamics in coastal sedimentary archives” – Nature:
Paper – http://www.nature.com/ngeo/journal/vaop/ncurrent/full/ngeo1619.html#ref1
“Here we present a reappraisal of high-energy estuarine and coastal sedimentary records from the southern coast of the English Channel, and report evidence for five distinct periods during the Holocene when storminess was enhanced during the past 6,500 years. We find that high storm activity occurred periodically with a frequency of about 1,500 years, closely related to cold and windy periods diagnosed earlier. We show that millennial-scale storm extremes in northern Europe are phase-locked with the period of internal ocean variability in the North Atlantic of about 1,500 years.”
A.D. Erlykina, B.A. Lakenb and A.W. Wolfendalea – Fluctuations in some climate parameters – Journal of Atmospheric and Solar-Terrestrial Physics:
Paper – http://www.sciencedirect.com/science/article/pii/S1364682611000319
“There is argument as to the extent to which there has been an increase over the past few decades in the frequency of the extremes of climatic parameters, such as temperature, storminess, precipitation, etc, an obvious point being that Global Warming might be responsible. Here we report results on those parameters of which we have had experience during the last few years: Global surface temperature, Cloud Cover and the MODIS Liquid Cloud Fraction. In no case we have found indications that fluctuations of these parameters have increased with time.”

Mike
Thank you all so much.
(Response to an article in The Australian 10-12-12)
It all started out with Anthropogenic Global Warming (AGW). When that was found to be too limiting it morphed into Anthropogenic Climate Change (ACC), so it didn’t matter if it got hotter or colder it was man’s fault and penance had to be paid. Unfortunately that didn’t grab the headlines or the purse strings so a new label came to the fore about a year ago; Extreme Weather Events (EWEs), which always grab the headlines. At least EWEs is an appropriate name for a mob of bleating sheep. And now at Doha a few nations, including Australia, but not countries such as NZ, USA, Canada Japan, China and Russia have agreed that compensation should be paid for natural EWEs such as floods in the Amazon, blizzards in Tibet or droughts in the Sahara. Now if only we could turn our Aussie politicians who agreed to this into wethers.
(For city folk who don’t know what ewes and wethers are look up your dictionary)
Looks like you need to find a new source for drought info 1900 to present. The page you cite has been suspended. Must be very recent since you saw it.
Looks like you need to find a new source for drought info 1900 to present. The page you cite has been suspended. Must be very recent since you saw it.
Updated with the same graph from a different location. Thank you.
A Rhetorical question, I’m sure. But since it’s NOAA data, it is clear that station siting HAS been accounted for. The well sited station trends have been carefully adjusted upwards to match the trends of the poorly sited stations. Sic.
The doomsday forecast was more frequent hurricanes, wetter everywhere as ice melted and put more water vapor in the air inducing more rain clouds and runaway heat boiling us like frogs at 100C. Oooops the data says opposite so its is left out.
How convenient is that
There are several types of college papers that college professors prefer
to give to their students. Only a professional HTML developer can provide a well structured and reliable website.