The High Cost of Cheap Labor | Center for Immigration Studies
The High Cost of Cheap Labor
Illegal Immigration and the Federal Budget
Table of Contents
Executive Summary
A Complex Fiscal Picture
Policy Implications
Summary Methodology
Introduction
Why Study the Fiscal Impact of Illegals?
Methodology
Data Source and General Principles
Estimated Tax Payments
Assigning Costs by Household
Adjustment for Under-Reporting in the CPS
Findings
Demographic Overview
Estimated Tax Payments
Costs by Household
Balance of Tax and Cost
The Fiscal Implications of Amnesty
Comparisons to Other Studies
Conclusion
Appendix
About the Author
Steven A. Camarota is Director of Research at the Center for
Immigration Studies in Washington, D.C. He holds a master's degree in
political science from the University of Pennsylvania and a Ph.D. in
public policy analysis from the University of Virginia. Dr. Camarota
often testifies before Congress and has published widely on the
political and economic effects of immigration on the United States. His
articles on the impact of immigration have appeared in both academic
publications and the popular press including Social Science Quarterly,
The Washington Post, The Chicago Tribune, Campaigns and Elections, and
The Public Interest. His most recent work published by the Center for
Immigration Studies includes: Immigration in a Time of Recession: An
Examination of Trends Since 2000; Where Immigrants Live: An Examination
of State Residency of the Foreign-Born; Back Where We Started: An
Examination of Trends in Immigrant Welfare Use Since Welfare Reform; and
The Open Door: How Militant Islamic Terrorists Entered and Remained in
the United States, 1993-2001.
Executive Summary
This study is one of the first to estimate the total impact of
illegal immigration on the federal budget. Most previous studies have
focused on the state and local level and have examined only costs or tax
payments, but not both. Based on Census Bureau data, this study finds
that, when all taxes paid (direct and indirect) and all costs are
considered, illegal households created a net fiscal deficit at the
federal level of more than $10 billion in 2002. We also estimate that,
if there was an amnesty for illegal aliens, the net fiscal deficit would
grow to nearly $29 billion.
Among the findings:
- Households headed by illegal aliens imposed more than $26.3 billion
in costs on the federal government in 2002 and paid only $16 billion in
taxes, creating a net fiscal deficit of almost $10.4 billion, or $2,700
per illegal household.
- Among the largest costs are Medicaid ($2.5 billion);
treatment for the uninsured ($2.2 billion); food assistance programs
such as food stamps, WIC, and free school lunches ($1.9 billion); the
federal prison and court systems ($1.6 billion); and federal aid to
schools ($1.4 billion).
- With nearly two-thirds of illegal aliens lacking a high
school degree, the primary reason they create a fiscal deficit is their
low education levels and resulting low incomes and tax payments, not
their legal status or heavy use of most social services.
- On average, the costs that illegal households impose on
federal coffers are less than half that of other households, but their
tax payments are only one-fourth that of other households.
- Many of the costs associated with illegals are due to
their American-born children, who are awarded U.S. citizenship at birth.
Thus, greater efforts at barring illegals from federal programs will
not reduce costs because their citizen children can continue to access
them.
- If illegal aliens were given amnesty and began to pay
taxes and use services like households headed by legal immigrants with
the same education levels, the estimated annual net fiscal deficit would
increase from $2,700 per household to nearly $7,700, for a total net
cost of $29 billion.
- Costs increase dramatically because unskilled immigrants
with legal status -- what most illegal aliens would become -- can access
government programs, but still tend to make very modest tax payments.
- Although legalization would increase average tax payments by 77 percent, average costs would rise by 118 percent.
- The fact that legal immigrants with few years of schooling
are a large fiscal drain does not mean that legal immigrants overall
are a net drain -- many legal immigrants are highly skilled.
- The vast majority of illegals hold jobs. Thus the fiscal
deficit they create for the federal government is not the result of an
unwillingness to work.
- The results of this study are consistent with a 1997 study
by the National Research Council, which also found that immigrants'
education level is a key determinant of their fiscal impact.
A Complex Fiscal Picture
Welfare use. Our findings show that many of the preconceived
notions about the fiscal impact of illegal households turn out to be
inaccurate. In terms of welfare use, receipt of cash assistance programs
tends to be very low, while Medicaid use, though significant, is still
less than for other households. Only use of food assistance programs is
significantly higher than that of the rest of the population. Also,
contrary to the perceptions that illegal aliens don't pay payroll taxes,
we estimate that more than half of illegals work "on the books." On
average, illegal households pay more than $4,200 a year in all forms of
federal taxes. Unfortunately, they impose costs of $6,950 per household.
 Social Security and Medicare.
 Although we find that the net
effect of illegal households is negative at the federal level, the same
is not true for Social Security and Medicare. We estimate that illegal
households create a combined net benefit for these two programs in
excess of $7 billion a year, accounting for about 4 percent of the total
annual surplus in these two programs. However, they create a net
deficit of $17.4 billion in the rest of the budget, for a total net loss
of $10.4 billion. Nonetheless, their impact on Social Security and
Medicare is unambiguously positive. Of course, if the Social Security
totalization agreement with Mexico signed in June goes into effect,
allowing illegals to collect Social Security, these calculations would
change.
The Impact of Amnesty. Finally, our estimates show that
amnesty would significantly increase tax revenue. Because both their
income and tax compliance would rise, we estimate that under the most
likely scenario the average illegal alien household would pay 77 percent
($3,200) more a year in federal taxes once legalized. While not enough
to offset the 118 percent ($8,200) per household increase in costs that
would come with legalization, amnesty would significantly increase both
the average income and tax payments of illegal aliens.
What's Different About Today's Immigration. Many native-born
Americans observe that their ancestors came to America and did not place
great demands on government services. Perhaps this is true, but the
size and scope of government were dramatically smaller during the last
great wave of immigration. Not just means-tested programs, but
expenditures on everything from public schools to roads were only a
fraction of what they are today. Thus, the arrival of unskilled
immigrants in the past did not have the negative fiscal implications
that it does today. Moreover, the American economy has changed
profoundly since the last great wave of immigration, with education now
the key determinant of economic success. The costs that unskilled
immigrants impose simply reflect the nature of the modern American
economy and welfare state. It is doubtful that the fiscal costs can be
avoided if our immigration policies remain unchanged.
Policy Implications
The negative impact on the federal budget need not be the only or
even the primary consideration when deciding what to do about illegal
immigration. But assuming that the fiscal status quo is unacceptable,
there are three main changes in policy that might reduce or eliminate
the fiscal costs of illegal immigration. One set of options is to allow
illegal aliens to remain in the country, but attempt to reduce the costs
they impose. A second set of options would be to grant them legal
status as a way of increasing the taxes they pay. A third option would
be to enforce the law and reduce the size of the illegal population and
with it the costs of illegal immigration.
Reducing the Cost Side of the Equation. Reducing the costs
illegals impose would probably be the most difficult of the three
options because illegal households already impose only about 46 percent
as much in costs on the federal government as other households. Thus,
the amount of money that can be saved by curtailing their use of public
services even further is probably quite limited. Moreover, the fact that
benefits are often received on behalf of their U.S.-citizen children
means that it is very difficult to prevent illegal households from
accessing the programs they do. And many of the programs illegals use
most extensively are likely to be politically very difficult to cut,
such as the Women Infants and Children (WIC) nutrition program. Other
costs, such as incarcerating illegals who have been convicted of crimes
are unavoidable. It seems almost certain that if illegals are allowed to
remain in the country, the fiscal deficit will persist.
Increasing Tax Revenue by Granting Amnesty. As discussed
above, our research shows that granting illegal aliens amnesty would
dramatically increase tax revenue. Unfortunately, we find that costs
would increase even more. Costs would rise dramatically because illegals
would be able to access many programs that are currently off limits to
them. Moreover, even if legalized illegal aliens continued to be barred
from using some means-tested programs, they would still be much more
likely to sign their U.S.-citizen children up for them because they
would lose whatever fear they had of the government. We know this
because immigrants with legal status, who have the same education levels
and resulting low incomes as illegal aliens, sign their U.S.-citizen
children up for programs like Medicaid at higher rates than illegal
aliens with U.S.-citizen children. In addition, direct costs for
programs like the Earned Income Tax Credit would also grow dramatically
with legalization. Right now, illegals need a Social Security number and
have to file a tax return to get the credit. As a result, relatively
few actually get it. We estimate that once legalized, payments to
illegals under this program would grow more than ten-fold.
From a purely fiscal point of view, the main problem with
legalization is that illegals would, for the most part, become unskilled
legal immigrants. And unskilled legal immigrants create much larger
fiscal costs than unskilled illegal aliens. Legalization will not change
the low education levels of illegal aliens or the fact that the
American labor market offers very limited opportunities to such workers,
whatever their legal status. Nor will it change the basic fact that the
United States, like all industrialized democracies, has a
well-developed welfare state that provides assistance to low-income
workers. Large fiscal costs are simply an unavoidable outcome of
unskilled immigration given the economic and fiscal realities of America
today.
Enforcing Immigration Laws. If we are serious about avoiding
the fiscal costs of illegal immigration, the only real option is to
enforce the law and reduce the number of illegal aliens in the country.
First, this would entail much greater efforts to police the nation's
land and sea borders. At present, less than 2,000 agents are on duty at
any one time on the Mexican and Canadian borders. Second, much greater
effort must be made to ensure that those allowed into the country on a
temporary basis, such as tourists and guest workers, are not likely to
stay in the country permanently. Third, the centerpiece of any
enforcement effort would be to enforce the ban on hiring illegal aliens.
At present, the law is completely unenforced. Enforcement would require
using existing databases to ensure that all new hires are authorized to
work in the United States and levying heavy fines on businesses that
knowingly employ illegal aliens. Finally, a clear message from
policymakers, especially senior members of the administration, that
enforcement of the law is valued and vitally important to the nation,
would dramatically increase the extremely low morale of those who
enforce immigration laws.
Policing the border, enforcing the ban on hiring illegal aliens,
denying temporary visas to those likely to remain permanently, and all
the other things necessary to reduce illegal immigration will take time
and cost money. However, since the cost of illegal immigration to the
federal government alone is estimated at over $10 billion a year,
significant resources could be devoted to enforcement efforts and still
leave taxpayers with significant net savings. Enforcement not only has
the advantage of reducing the costs of illegal immigration, it also is
very popular with the general public. Nonetheless, policymakers can
expect strong opposition from special interest groups, especially ethnic
advocacy groups and those elements of the business community that do
not want to invest in labor-saving devices and techniques or pay better
salaries, but instead want access to large numbers of cheap, unskilled
workers. If we choose to continue to not enforce the law or to grant
illegals amnesty, both the public and policymakers have to understand
that there will be significant long-term costs for taxpayers.
Summary Methodology
Overall Approach. To estimate the impact of households headed by
illegal aliens, we rely heavily on the National Research Council's (NRC)
1997 study, "The New Americans." Like that study, we use the March
Current Population Survey (CPS) and the decennial Census, both collected
by the Census Bureau. We use the March 2003 CPS, which asks questions
about income, household structure, and use of public services in the
calendar year prior to the survey. We control total federal expenditures
and tax receipts by category to reflect actual expenditures and tax
payments. Like the NRC, we assume that immigrants have no impact on
defense-related expenditures and therefore assign those costs only to
native-headed households. Like the NRC, we define a household as persons
living together who are related. Individuals living alone or with
persons to whom they are unrelated are treated as their own households.
As the NRC study points out, a "household is the primary unit through
which public services are consumed and taxes paid." Following the NRC's
example of using households, many of which include U.S.-citizen
children, as the unit of analysis makes sense because the presence of
these children and the costs they create are a direct result of their
parents having been allowed to enter and remain in country. Thus,
counting services used by these children allows for a full accounting of
the costs of illegal immigration.
Identifying Illegal Aliens in Census Bureau Data. While the
CPS does not ask respondents if they are illegal aliens, the Urban
Institute, the former Immigration and Naturalization Service (INS), and
the Census Bureau have used socio-demographic characteristics in the
data to estimate the size and characteristics of the illegal population.
To identify illegal aliens in the survey, we used citizenship status,
year of arrival in the United States, age, country of birth, educational
attainment, sex, receipt of welfare programs, receipt of Social
Security, veteran status, and marital status. This method is based on
some very well-established facts about the characteristics of the
illegal population. In some cases, we assume that individuals have zero
chance of being an illegal alien, such as naturalized citizens,
veterans, and individuals who report that they personally receive Social
Security benefits or cash assistance from a welfare program or those
who are enrolled in Medicaid. However, other members of a household,
mainly the U.S.-born children of illegal aliens, can and do receive
these programs. We estimate that there were 8.7 million illegal aliens
included in the March 2003 CPS. By design, our estimates for the size
and characteristics of the illegal population are very similar to those
prepared by the Census Bureau, the INS, and the Urban Institute.
Estimating the Impact of Amnesty. We assume that any amnesty
that passes Congress will have Lawful Permanent Residence (LPR) as a
component. Even though the President's amnesty proposal in January seems
to envision "temporary" worker status, every major legalization bill in
Congress, including those sponsored by Republican legislators, provides
illegal aliens with LPR status at some point in the process. Moreover,
Democratic presidential nominee John Kerry has indicated his strong
desire to give LPR status to illegal aliens.
To estimate the likely impact of legalization, we run two different
simulations. In our first simulation, we assume that legalized illegal
aliens would use services and pay taxes like all households headed by
legal immigrants with the same characteristics. In this simulation, we
control for the education level of the household head and whether the
head is from Mexico. The first simulation shows that the net fiscal
deficit grows from about $2,700 to more than $6,000 per household. In
the second simulation, we again control for education and whether the
household head is Mexican and also assume that illegals would become
like post-1986 legal immigrants, excluding refugees. Because illegals
are much more like recently arrived non-refugees than legal immigrants
in general, the second simulation is the more plausible. The second
simulation shows that the net fiscal deficit per household would climb
to $7,700.
Results Similar to Other Studies. Our overall conclusion that
education level is the primary determinant of tax payments made and
services used is very similar to the conclusion of the 1997 National
Research Council report, "The New Americans." The results of our study
also closely match the findings of a 1998 Urban Institute study, which
examined tax payments by illegal aliens in New York State. In order to
test our results we ran separate estimates for federal taxes and found
that, when adjusted for inflation, our estimated federal taxes are
almost identical to those of the Urban Institute. The results of this
study are also buttressed by an analysis of illegal alien tax returns
done by the Inspector General's Office of the Department of Treasury in
2004, which found that about half of illegals had no federal income tax
liability, very similar to our finding of 45 percent.
Introduction
As illegal immigration has increased dramatically over the last two
decades, so has concern about its impact on American taxpayers. While
other consequences are clearly important, the fiscal impact of illegal
immigration is at the center of the ongoing debate. Surprisingly, few
studies have attempted to measure the total fiscal effect of illegal
immigration on the United States. Several studies have focused on all
immigrants, making no distinction by legal status, and other researchers
have examined either the costs imposed by illegals or the tax payments
they make, but not both together. Most of this work has focused on the
state and local level, giving little or no attention to the federal
government. Focusing on the federal government, this study attempts to
answer two related questions: First, what effect do illegal aliens have
on the fiscal balance (all taxes paid minus all services used)? Second,
what would happen to the fiscal balance if illegal aliens were
legalized?
Why Study the Fiscal Impact of Illegals?
Concern over illegal immigration ranges from national security and the
rule of law to the risk would-be illegals take to enter the country and
their well-being once here. But the fiscal effects are a key part of the
issue. In fact, much of the public's anger over illegal immigration
stems from the belief that illegals are a drain on taxpayers. Past
policy responses to illegal aliens, such as barring them from welfare
programs, were also driven by the desire to minimize fiscal costs. Thus,
determining the actual fiscal impact of illegal immigration is
critically important to formulating a policy response to illegal
immigration.
The Fiscal Equation. Simply by living in the United States,
illegals unavoidably impose some costs on government. Like all people,
illegal aliens enroll their children in public schools, drive on the
roads, and engage in a host of other activities that necessarily cost
government money. They also unavoidably pay taxes. Even when they are
paid "off the books," they still pay excise and other types of taxes to
the government. So the fact that illegal aliens cost public coffers
money does not necessarily mean they are a net drain. Conversely, the
fact that illegals pay taxes does not necessarily mean that they are a
fiscal benefit. At least with regard to fiscal considerations, the key
question is the balance between the taxes they pay and the services they
use. This study attempts to estimate both their tax payments and costs
in order to determine their net fiscal impact at the federal level.
Importance of Current Fiscal Impact. Almost all observers
agree that illegal immigration is a problem. The fiscal impact of
illegal immigration has enormous bearings on the question of what to do
about illegal immigration. While employers may want access to immigrant
labor, the fiscal costs to taxpayers must be considered. Understandably,
employers can be counted on to ignore these costs because they are
diffuse, borne by all taxpayers, while the benefit to businesses is
obvious. Policy makers, however, must be sensitive to fiscal
considerations. If there are net costs, then this could have a
significant impact on the availability of public services or the tax
burden on Americans. If the costs are very large, then the problem is
certainly more urgent. And devoting significant resources to reducing
illegal immigration may be justified because doing so would leave
taxpayers with a significant net savings. On the other hand, if illegals
impose little or no costs on taxpayers, this too should play some role
in shaping policy.
Legalizing Illegals. Many politicians have indicated their
strong desire to give illegal aliens legal status, but the fiscal
implications of amnesty are almost never addressed. Since legalization
should significantly change both the amount of taxes illegals pay and
the level of services they use, it is absolutely essential to determine
how amnesty might change the fiscal balance. If an amnesty would
increase the net fiscal costs, then policymakers may want to consider
other solutions. If amnesty creates a net fiscal benefit, then
legalization might make sense. While factors other than the impact on
federal coffers have to be taken into account, by estimating both the
current fiscal impact of illegal immigration and the impact of amnesty,
this report should provide at least part of an answer to the questions
surrounding illegal immigration. Of course, it must be noted that this
report does not address the fiscal impact at the state and local level
and any complete accounting should examine those areas as well.
Methodology
Probably the most important study on the fiscal effects of
immigration was conducted by the National Research Council (NRC) in
1997.
1
Our analysis relies heavily on the approach used in the NRC study as
the basis for estimating the fiscal impact of immigration. The NRC
actually reported two different estimates for the fiscal impact of
immigration, a household-level analysis of the current fiscal impact and
an intergenerational analysis looking at immigrants and their
descendents over a 300-year period. Our analysis primarily follows the
example of the NRC's household level analysis because we are interested
in estimating the current fiscal impact of illegals on the federal
budget. However, we also report separate estimates for immigrants by
education level as was done in the NRC's intergenerational analysis.
Another important study was conducted in 1998 by the Urban Institute.
That study only estimated tax payments in New York State, including
some federal taxes. But unlike the NRC study, the Urban Institute New
York study estimated tax payments for legal and illegal immigrants
separately, though it did not consider service use. This is one of the
only studies today that has examined tax payments by illegal aliens, and
so we rely on some of that study's approach as well.
2
Other important studies that have examined the fiscal impact of
immigration include a 2001 study of Florida, a 1997 study of New Jersey
(which was included in the NRC study), and one in 1994 by the Center for
Immigration Studies.
3
Almost all fiscal studies of immigration attempt to measure the taxes
paid by immigrant households and the services they use. This study
follows the same approach. We also make the same implicit assumption of
almost all fiscal studies, including the NRC's: that if immigrants
create a fiscal deficit, then taxes simply rise to cover the added
expenses while services remain the same rather than taxes staying the
same and services being reduced. Whether natives have to pay more to
retain the same level of services or receive less in services for the
same price, the outcome is still bad for them. Conversely, if illegal
immigrants pay more in taxes than they use in services then this would
be a clear benefit for natives because they could receive the same level
of services but pay less in taxes.
Data Source and General Principles
Data Source. This report relies on the March 2003 Current
Population Survey (CPS) collected by the U.S. Census Bureau. The March
data, also called the Annual Social and Economic Supplement, includes an
extra-large sample of minorities and is considered one of the best
sources of information on the foreign-born.
4 The foreign-born are defined as persons living in the United States who were not U.S. citizens at birth.
5
For the purposes of this report, foreign-born and immigrant are used
synonymously. The Survey includes most legal immigrants and is thought
to capture roughly 90 percent of the illegal alien population. We use
the term illegal alien or illegal immigrant to mean those who responded
to the survey who are in the United States without authorization. All
other foreign-born persons are referred to as legal immigrants,
including those with Permanent Residence, those who are naturalized
American citizens, and those living in the United States on long-term
temporary visas, mainly guest workers and foreign students.
The CPS asks respondents about their income and program use in the
calendar year prior to the Survey, so all fiscal estimates in the study
are for 2002.
6
Almost all past research on the fiscal impact of immigrants has relied
on CPS or Decennial Census data, including the NRC and the Urban
Institute studies. Information about actual taxes collected by the
federal government by source comes from the Office of Management and
Budget.
7 Information on actual federal expenditures on means-tested programs comes from the Congressional Research Service.
8 Information on other expenditures comes from a variety of government publications.
9
Identifying Illegal Aliens. The CPS does not ask the
foreign-born if they are legal residents of the United States. However,
the Urban Institute, the former INS, and the Census Bureau have used
socio-demographic characteristics in the data to estimate the size of
the illegal population. To determine who are legal and illegal
immigrants in the survey, this report uses citizenship status, year of
arrival in the United States, age, country of birth, educational
attainment, sex, receipt of welfare programs, receipt of Social
Security, veteran status, and marital status. We use these variables to
assign probabilities to each respondent. Those individuals who have a
cumulative probability of one or higher are assumed to be illegal
aliens. The probabilities are assigned so that both the total number of
illegal aliens and the characteristics of the illegal population closely
match other research in the field, particularly the estimates developed
by the Urban Institute.
This method is based on some well-established facts about the
characteristics of the illegal population. For example, it is well known
that illegals are disproportionately male, unmarried, under age 40,
have few years of schooling, etc. Thus, we assign probabilities to these
and other factors in order to select the likely illegal population. In
some cases we assume that there is no probability that an individual is
an illegal alien. If an individual reports that he is U.S.-born or a
naturalized citizen of the United States, then he is assumed not to be
an illegal alien. Someone who reports that he is veteran or receives
veteran benefits is also assumed not to be an illegal alien. Those
individuals who report that they personally receive Social Security
benefits, cash assistance under Temporary Assistance to Needy Families
(TANF), Supplemental Security benefits (SSI), or who are enrolled in
Medicaid are also assumed not to be illegal aliens. However, other
members of a household headed by an illegal alien can receive these
programs, mostly the U.S.-born children of illegals. It is worth noting
that our findings show that only a tiny fraction of households headed by
illegals receive cash welfare programs or Social Security benefits.
However, a large share of children in illegal alien households use the
school lunch program or are enrolled in Medicaid. Our methodology allows
for such a possibility.
We estimate that there were 8.7 million illegal aliens in the March
2003 CPS. It must be remembered that this estimate only includes illegal
aliens captured by the March CPS, not those missed by the survey.
10
By design this estimate is very similar to those prepared by the Census
Bureau, the former Immigration and Naturalization Service (INS), and
the Urban Institute.
11
Although it should be obvious that there is no definitive means of
determining whether a respondent in the survey is an illegal alien, the
findings in this study are consistent with previous research. For
example, the Urban Institute estimated that in 2002 Mexicans accounted
for 57 percent of the illegal population; our method finds 58 percent in
2003. Using 2003 data, we estimate that 88 percent of illegals arrived
after 1990; the Urban Institute estimated 85 percent using 2002 data.
12 Our results also produce estimates that are similar in other areas, such as age and workforce participation.
Unit of Analysis. We divide households between those headed by
illegal aliens and all others. In reference to its fiscal estimates,
the NRC states, "Since the household is the primary unit through which
public services are consumed and taxes paid, it is the most appropriate
unit as a general rule and is recommended for static analysis."
13
Because our study is also focused on "static analysis," or current
fiscal effects of illegal aliens, we also examine taxes paid and
services used by households based on the nativity and legal status of
the household head. Like the NRC study, we define households as all
persons living together who are related. Persons living with individuals
to whom they are unrelated or who live alone are considered their own
household. This definition could also be referred to as a "family," but
following the NRC's example, we call it a household.
In their study of New Jersey, Deborah Garvey and Thomas Espenshade
also used households as the unit of analysis because "households come
closer to approximating a functioning socioeconomic unit of mutual
exchange and support."
14
Another reason for using households is that Census Bureau surveys are
collected by household, making households the most appropriate use of
the survey. Even so, it must be remembered that grouping by household,
even the modified definition of household used in the NRC study and this
report, means that many children born in the United States to illegal
aliens are included in illegal alien-headed households even though these
children are U.S. citizens by virtue of being born here. This seems
perfectly reasonable since the presence of these children in the United
States is a direct result of their parents having been allowed to enter
and remain in the United States. Thus, counting services used by these
children allows for a full accounting of the costs of illegal
immigration.
Marginal vs. Average Costs. Like the NRC, we assume that
average costs equal marginal costs. That is, an additional person or
household using a program or service costs the same as those already
using the service. This, of course, is not always the case. For example,
the addition of a few new students to a half empty school costs
relatively little because the school is already built and so no
additional funding is needed for school construction. In such a
situation the marginal costs of the new students are much less than
average costs for the students already in the school. On the other hand,
an additional group of students added to an already overcrowded school
may require a whole new school to be built, thus making the marginal
costs of the additional students much greater than the average cost. The
NRC and others assume that marginal and average costs are equal and
that these two tendencies should balance each other out over time.
Private vs. Public Goods. Some goods provided by government
are pure public goods; that is, everyone living in the country benefits
from receiving them. At the same time, the cost of providing them does
not rise as the number of people living in the country increases. The
most important example of this type of program is national defense. Like
the NRC study, we assume that defense is a pure public good at the
federal level, therefore no costs for providing defense are assigned to
immigrant households. We further assume that, with the exception of
means-tested programs for veterans, which illegals cannot use, all
non-means-tested veterans programs are also pure public good. This means
that the nearly $388 billion spent on defense and veterans programs in
2002 is assigned only to native households.
Interest on the National Debt and Federal Deficits. Following
the example of the NRC, we do not include interest payments on the
national debt in our calculations of costs because it is impossible to
determine what share of the debt was incurred due to illegals.
Obviously, illegal aliens who just arrived in the country have not
contributed at all to past deficits or to the cumulative total of those
deficits -- the national debt. On the other hand, if immigrant
households created a net fiscal burden in past years then they might
account for a disproportionate share of the current national debt. Thus,
like most previous studies, including the NRC, we do not count interest
on the national debt as a cost for either immigrant or native
households. This means that the study measures only the fiscal impact of
illegal alien households on what the NRC calls the "primary" budget.
The primary budget is comprised of all tax payments and all federal
expenditures other than interest payments on the national debt.
Because debt interest payments ($170.95 billion) were slightly larger
in size than the federal deficit ($157.80 billion) in 2002, the primary
budget had a $13.15 billion surplus in 2002. However, we exclude from
our analysis the $23.7 billion that the Federal Reserve earned from
interest on federal reserve deposits, which come from investing in U.S.
government securities. These monies are in effect the federal government
paying itself and, although these monies are officially considered
revenue, we do not count them as such in this report because we do not
include the interest the federal government pays on the national debt as
an expense. As a consequence, there was a $10.5 billion deficit ($85
per household) in the primary budget when interest earned on federal
reserve deposits is excluded.
Economic Impact of Illegal Aliens. Like most studies of this
kind, including the NRC's, ours does not consider how illegal
immigration or immigration more generally might affect public coffers
indirectly by its impact on the economy. There simply is no consensus on
the economic impact of immigration. To the extent that the issue has
been studied, the impact on the nation's economy is generally thought to
be trivial relative to the size of the economy. In addition to its
fiscal estimates, the National Research Council estimated that
immigration created a net economic benefit to natives of between $1
billion to $10 billion in the mid-1990s, or an amount equal to one or
two-tenths of 1 percent of the nation's economy at that time. And these
figures are for all immigrants, not specially for the one-fourth of the
foreign-born who are illegal aliens. Moreover, the same study found that
immigration reduced the wages of native-born workers who lack a high
school education by about 5 percent. Not only would this reduction lower
the tax payments of unskilled natives, but it would almost certainly
result in higher use of means-tested programs by these workers, who
roughly correspond to the poorest 10 percent of the workforce. Thus it
is not clear that the economic impact of illegal immigration would have
even a tiny net positive effect on the public coffers. A more recent
study from the National Bureau of Economic Research suggests that
immigration, legal and illegal, has a decidedly negative impact on the
income of all Americans.15 If that study is correct and there is a net
loss for native-born Americans, then the tax payments of immigrants are
much lower, while their use of services is higher as result of their
lower incomes. Because the actual economic impact is probably modest
relative to the overall size of the U.S. economy and there is little
agreement on whether the effect is positive or negative, we follow the
example of almost all other studies and focus on the direct taxes and
services illegals pay and use.
Estimated Tax Payments
All studies of this kind involve estimating payroll and other taxes paid
by households based on their characteristics: primarily income, number
of dependents, and home ownership. In this study, all taxes collected by
the federal government are assigned to households. There is general
agreement that excise taxes and payroll taxes, including those paid by
employers such as unemployment, are ultimately borne by households.
However, there is some debate about who actually pays coporate income
tax--consumers or owners of capital. In this study we follow the example
of the Office of Management and Budget and assume that owners of
capital pay corporate income tax. All tax payments are adjusted to
reflect actual total taxes collected by the federal government from each
source for the year.
16
We assign all taxes to U.S. residents and ignore the small share of
persons living outside of the United States who pay federal taxes.
Payroll Taxes. There are four main payroll taxes collected by
the federal government: income, Social Security, Medicare, and
Unemployment Compensation. The Current Population Survey contains income
tax and Social Security tax liabilities calculated by the Census Bureau
for all tax-paying units in the Survey. In short, the Census Bureau
uses data from the American Housing Survey, the Income Survey
Development Program, and the Internal Revenue Service and combines this
information with CPS data to create simulations of tax liabilities for
all persons reporting income.
17
We use the tax liability estimates from the Census Bureau to calculate
federal income and Social Security tax liability for each household.
18
We calculate both Medicare and Unemployment tax as a share of earning.
Again, both the employee and employer share are assigned to households
because previous research indicates that even the employer share of
payroll taxes is ultimately borne by workers.
Corporate Income Tax. There is some debate about who actually
pays corporate income taxes--owners of capital or consumers. The Office
of Management and Budget in its estimates of the tax burden on American
households distributes corporate income taxes based on each household's
share of capital income, and we do the same in this study. We calculate
corporate income tax as a share of interest and dividend income as
reported in the CPS.
Excise and Estate Taxes. In addition to payroll taxes, the
federal government collects taxes on a number of goods, mainly tobacco,
alcohol, transportation fuels, and tires. We follow the NRC study's
approach and allocate tobacco and alcohol taxes based on the number of
people of drinking and smoking age in each household. Excise taxes,
mainly the telephone tax and those collected for the highway and airport
trust funds, are allocated as a share of household income. All tariffs
collected on foreign goods are also assumed to be borne by consumers and
are therefore allocated as a share of household income. Like the NRC
study, we also allocated estate taxes to native households and to
immigrant households that have been in the country for more than 20
years. Since the methodology we use to identify illegal aliens assumes
that the vast majority of illegal aliens have been in the country for
less than 20 years, the contributions of illegal aliens are very small.
Tax Compliance. While illegal aliens are assumed to pay their
share of non-payroll taxes, payroll taxes collected by employers or
income and other taxes paid by the self employed are a different matter.
There is some research to indicate that only about half of illegal
aliens are "paid on the books."
19
That is, income and other taxes are withheld from their pay. In their
study of New York State, Jeffrey Passel and Rebecca Clark assumed 60
percent compliance. In their study of New Jersey, Clark and Zimmermann
assumed a 56 percent compliance rate.
20
New York and New Jersey are somewhat unusual because a smaller fraction
of each state's illegal population is employed in agriculture than is
true nationally, a sector where being paid off the books is very common.
However, we follow the same basic approach and assume that 55 percent
of illegal aliens are paid on the books. We implement this by reducing
the Income Tax and Social Security, Medicare, and Unemployment Tax of
illegal households to 55 percent of their estimated tax liability.
Assigning Costs by Household
The CPS asks respondents a host of questions about their use of
means-tested and non-means-tested federal programs. Like the NRC study
and virtually all other studies on this topic, we use these results to
estimate immigrant and native use of federal programs. Because the CPS
began asking many more questions about use of public services in 2001,
we are able to make specific estimates for a larger number of programs
than was possible at the time of the NRC study, which relied on the 1995
CPS and 1990 Census. It should be remembered that the March 2003 CPS,
the data source used in this study, asks questions about use of federal
programs in the calendar year prior to the Survey, therefore all
estimates reported here are for 2002. In that year expenditures in the
primary federal budget totaled $1.84 trillion.
Social Insurance. We use the results in the CPS to estimate
household receipt of Social Security, Medicare, and Unemployment
Compensation. We assume that illegals receive no federal disability
because these payments primarily go to federal workers or coal miners
with black lung. For Social Security, we use responses in the CPS on the
amount received. The same is true of Unemployment Compensation. The
Survey also asks about receipt of Medicare. (Contrary to the common
perception, persons under age 65 can qualify for Medicare, mainly those
with end-stage renal disease.) For Medicare, we assigned average costs
of the program to those who indicated they received it. As already
indicated, we assume that persons getting Social Security cannot be
illegal aliens. However, in a few cases members of their family can use
these programs. As a result, costs for these two programs for illegals
are extremely low relative to the rest of the population, but not zero.
Food Stamps and Cash Assistance. The CPS asks respondents the
size of the payment they receive from the following programs:
Supplemental Security Income, Temporary Assistance to Needy Families
(TANF), cash assistance for low-income veterans, food stamps, low-income
energy assistance, and higher education assistance. We use the payments
respondents report to directly estimate average cost by household.
Because food stamp values are reported in the CPS using the standard
definition of household, and because we use a modified definition of
household, food stamp values received by households with multiple
families are divided based on the size of the each family in the
household.
Other Non-Cash Means-Tested Programs. The Survey also asks about receipt of the Women Infants and Children program (WIC) and Free School Lunch program
21
and whether someone lives in public housing or receives a rent subsidy.
For WIC, public housing, and rent subsidies we assigned average costs
of each program to households receiving it. For Medicaid, the Census
provides estimates by disability status for all beneficiaries in the
CPS. Again, it should be remembered that only federal costs of the
program are considered in this study. For social services provided by
the TANF program, we assigned costs evenly to households based on
receipt of TANF. For government subsidized daycare, which relatively few
illegals use, we assign average costs for households that indicated in
the CPS that they receive child care services. College students in
non-illegal households are assumed to be getting Stafford student loans
if the household income is less than $75,000 a year. For illegal
households, student loans are assumed only if the college student
himself is an American citizen. Thus, while there are a few college
students from illegal alien households receiving student loans, the
number is extremely small. Illegal alien households are assumed to
impose no costs on programs designed only for refugees. The same is true
for programs for low-income veterans because our methodology assumes
that all persons who indicate they are veterans cannot be illegal
aliens.
The Earned Income Tax Credit. Based on income and other family
characteristics, the Census Bureau provides estimated payments for the
Earned Income Tax Credit (EITC), which it includes in the public use
files of the CPS. We assume that natives and legal immigrants receive
their EITC payments, but for illegal aliens we assume that only the 55
percent who are paid "on the books" can receive the program.
Furthermore, we assume that one-fourth of those who are paid on the
books and who also qualify for the program actually get it. To implement
this, we reduce the Census Bureau's estimated EITC payments by 86
percent for illegal alien households. It should be noted that,
officially, a valid Social Security number is required to collect the
EITC. However, a Treasury Department Inspector General for Tax
Administration report found that a small number of illegals without
valid Social Security numbers did receive the EITC.
22
Using this approach we estimate that illegal households only account
for 1.5 percent of the total costs of the EITC. However, if they
received the payments they qualify for based on their income and number
of dependents they would account for more than 10 percent of the
program's total costs.
23
The ACTC. In addition to the EITC, there is the Additional
Child Tax Credit (ACTC), also called the refundable portion of the Child
Tax Credit, which pays out a total of $5 billion a year to low-income
workers with children. To estimate the cost of this program, we assign
benefits to all native and legal immigrant households that have earnings
over $10,000 and no federal income tax liability, based on the number
of children under age 16 in the household. For illegals, we further
assume that only 40 percent of those households that qualify based on
our analysis of the CPS actually get the ACTC. This is much higher than
for the EITC because illegals are explicitly allowed by law to get the
credit. Thus they can receive the credit even if they do not have a
stolen identity and Social Security number. If they don't have a valid
SSN, they can still get the credit by obtaining an Individual Taxpayer
Identification Number (ITIN) from the IRS, which is not difficult, and
filing a return using the ITIN. The 2004 report by the Treasury
Department Inspector General for Tax Administration mentioned above
found that, in 2001, 203,000 tax forms filed by illegals got a cash
payment from the Child Tax Credit using an ITIN. These illegals received
a total payment of $161 million in that year--even if the SSNs on their
W-2 forms were not valid.
This amount indicates that about 30 percent of illegals we identified
in the CPS receive benefits from the program. We adjust this up to 40
percent because the Inspector General's report did not attempt to
estimate receipt of the program by illegals who use stolen identities
and Social Security numbers to file their returns; only use of the ITIN
was considered. This adjustment has the effect of increasing the total
cost of the program for illegals to $216 million in 2002.
Primary and Secondary Education. We allocate almost all of the
federal funds for public education by household based on the number of
school-age children in each household. The only exceptions are programs
designed to assist schools that have a large number of children whose
parents are migrants and those funds that specifically go to children
with limited English. For programs designed specifically to improve the
education of low-income children whose parents work in
agriculture--mainly the Chapter I Migration Education Program -- we
assign costs based on whether the household head works in agriculture
and the number of school age children in the household. To allocate
federal funds for children with limited English, we use the 2000 Census
to calculate the share of school-age children who reported that they
spoke English less than very well. The 2000 Census showed that 29.2
percent of school-age children in immigrant households (legal and
illegal) spoke English less than very well, compared to 2 percent of
those in native households. We assume the same percentages existed in
2002 and assigned costs accordingly.
Uninsured. Research by Jack Hadley and John Holahan indicates that federal expenditures for the uninsured totaled $21.03 billion in 2002.
24
We exclude from this total the $3.98 billion estimated to have been
spent by the Department of Veterans Affairs on those without health
insurance. (Illegals cannot receive health care from the VA and veteran
benefits of this kind are treated as a pure public good in this
analysis, so they are assigned only to native households). This means
that $17.05 billion was spent by the federal government on the
uninsured, not counting treatment from the VA. We then allocate these
costs to households based on the number of uninsured persons per
household.
INS, Federal Prisons, and Courts. We assign the net costs of
the Immigration and Naturalization Service (expenditures minus fees the
service collected), by household based on the distribution of immigrants
(legal or illegal) who indicated they arrived after 1980.
25
It should be noted that not all of the net costs of the INS are
attributable to immigrant-headed households because some post-1980
immigrants live in native households. We estimate that about 8 percent
of post-1980 immigrants live in households headed by natives and as
such, native households account for 8 percent of the net costs of the
INS.
26
We do not include costs for running the immigration functions of the
Department of State because this system is paid for by fees. As for the
the federal prison system, it keeps track of whether inmates are
citizens of the United States or not. In 2002, nearly 29 percent, or
39,000 inmates in the federal prison system were non-citizens. Based on
prior research, we estimated that 59 percent of this total are illegal
aliens.
27
This translates into 17 percent of the federal prison population and
thus 17 percent of the $4.1 billion prison budget can be attributed to
illegal alien households. For the cost of administering the federal
court system, we again assume that 17 percent of the costs are
attributable to illegal households. This estimate is probably too low
because non-citizens in 2001, the last year for which data is available,
accounted for 38 percent of those arrested by federal agencies and 34
percent of those actually convicted in federal courts.
28
This is significantly higher than the 29 percent of the prison
population they represent. Nonetheless, we assign only 17 percent of the
$4.7 billion federal court system budget to illegals in order to make
our estimates more conservative.
29
As is the case for the federal prison system, when later in this report
we estimate costs for households headed by legal immigrants we assume
that 16 percent of the costs of the federal courts are due to households
headed by legal immigrants (naturalized and unnaturalized).
All Other Expenditures. Using the results from the methodology
described above, we are able to estimate almost $1.1 trillion in
federal spending, or 58 percent of the primary budget. In addition to
specific programs, we account for $388.1 billion, or another 21 percent
of the primary 2002 federal budget, that went to spending on defense and
non-means-tested veterans programs. As already noted, only native
households are assigned costs for defense and veterans programs because
they are assumed to be pure public goods and as such legal and illegal
immigrants impose no costs on these programs. The remaining $386
billion, or 21 percent of the primary budget, is assigned to all
households equally. This totals $3,115 per household. These expenditures
include highway and infrastructure maintenance, parts of the criminal
justice system not accounted for already, subsidies to business, state
aid, and all other services provided by the federal government. This is
the same approach used by the NRC and almost all studies of this kind.
It should be noted that allocating costs equally to all households may
tend to underestimate the costs of illegals because illegal households
are 17 percent larger on average than other households. All other things
being equal, more people per household should mean higher average
expenses. But we ignore this and assign costs equally to all households.
Adjustment for Under-Reporting in the CPS
Under-Reporting of Program Use. It is well established that
respondents tend to understate both their income and use of social
services in the CPS. This problem is well known by the Census Bureau and
has been studied for some time.
30
To correct for this problem, we adjust all social programs to reflect
actual federal expenditure. This is based on the assumption that
immigrants and natives are equally likely to under-report their use of
social services. The NRC study also seems to have controlled for this
problem.
31
Adjustments of this kind may tend to understate program use by
immigrants because they may be more reluctant to report use of
means-tested programs in a government survey than other members of
society out of a fear that this might constitute grounds for
deportation. But we ignore this problem and assume that under-reporting
rates are the same for all persons. As mentioned earlier, controlling
all costs to actual expenditures has the added advantage of allowing us
to estimate the costs of illegals not counted in the CPS. In effect,
those who are counted are assigned costs for those who are missed by the
survey. The same is true for non-illegal aliens who are missed by the
survey. This means our cost estimates are for all illegals, even those
the survey misses.
Under-Reporting of Income and Taxes. For tax payments, we
adjust upward the income tax estimates calculated by the Census Bureau
to reflect actual tax receipts. However, following the example of the
Urban Institute in its study of New York State, we do so only for
households with incomes of over $200,000 a year. This adjustment is
based on the assumption that it is high-income households who
under-report their income. While the Urban Institute first adjusted
income for those with high income and then recalculated taxes, by
adjusting tax receipts our approach has the same effect. For Social
Security, we adjust payments for all taxpayers, not just those with high
incomes, because only the first $84,900 of earnings was subject to the
tax in 2002. Thus, under-reporting by high income earners does not
matter. As is the case with costs, controlling all tax payments to the
actual tax totals received by the federal government allows us to
estimate the tax payments of illegals not counted in the CPS. In effect,
those who are counted are assigned costs for those who are missed by
the survey. The same is true for non-illegal aliens who are missed by
the survey. This means that our tax estimates for all illegal and
non-illegal households reflect the total taxes these populations pay,
even those not counted by survey.
Findings
Demographic Overview
Characteristics of Illegal Households. Table 1 reports
demographic information for households headed by illegal immigrants and
all other households. Not surprisingly, it shows that on average
households headed by illegal aliens have much lower average incomes and
are somewhat larger in size than the average household in America. The
lower income reflects not simply their legal status, but more
importantly the fact that such a large share of illegals have little
formal education. An estimated two-thirds of illegals who are household
heads lack a high school diploma. This is important because it means
that even if the illegal aliens were legal residents, their income still
would be dramatically lower than the rest of the population. There is
no single better predictor of income in the modern American economy than
one's education level. As a result, a large share of illegals are
likely to remain poor even if given legal status. Table 1 also shows the
share of households in which at least one person works. A much larger
share of illegal households had at least one person working in 2002 than
non-illegal households. Thus, any costs associated with illegal aliens
do not reflect low rates of employment.
Illegal Household Use of Services. The lower portion of Table 1
shows the percentage of illegal households receiving Social Security
and means-tested programs. There are very large differences in program
usage between illegals and the rest of the population. Just as
important, illegals' use of different types of programs vary enormously.
Only a tiny fraction of illegal households use Social Security or cash
welfare programs compared to other households. One source of public
dissatisfaction with illegal immigration is that some Americans believe
that many illegal aliens are getting cash welfare payments. Table 1
shows that this is not the case. However, the share using Medicaid and
food assistance welfare programs is quite high and substantially more
than the share of non-illegal households.

It must be remembered that, for the most part, illegal households
using programs like free school lunch or Medicaid are receiving these
benefits on behalf of U.S.-born children, who under current law are
awarded citizenship at birth. Of course, the costs of providing services
to these children are very real for taxpayers and result from illegals
having been allowed to enter and stay in the country. And having the
federal government feed or provide medical care to their children is an
enormous benefit to illegal aliens. Thus, in considering the
consequences for public coffers, counting the costs of these programs is
necessary, otherwise one would gain a very false sense of illegal
immigration's present costs. Nonetheless, the fact that it is the
U.S.-born children receiving the benefits is still important, because it
means that barring illegals from using programs would not significantly
reduce costs. Their citizen children would continue to receive them. On
the other hand, if the illegal families were made to return home, the
costs would be eliminated.
Estimated Tax Payments
Payroll Taxes. Table 2 shows a breakdown of the estimated tax
payments and services used by illegal alien-headed households. (More
details about illegals' payment of specific taxes and use of specific
programs use can be found in the Appendix on p. 39.) In terms of tax
payments, the table shows very large differences between illegal
households and other residents. The largest difference is in federal
income taxes. Illegal households pay only about one-fifth as much as
other households. This is not surprising given their much lower incomes
and larger family size. By design, households with modest incomes and
large size are supposed to pay relatively little in taxes. This, coupled
with the fact that only a little over half of illegals make payroll
contributions, is the reason their payments are very low relative to
other taxpayers. For taxes other than income tax, the difference between
illegal households and all others is not quite as large. Because
Medicare and unemployment are more regressive in nature than federal
income tax, the contribution of illegals for these two taxes is about 37
percent that of other households' contributions. And for Social
Security, which is even more regressive, illegals pay 40 percent of the
average household's contribution.

It must be remembered that tax payments in the table are based on the
assumption that only 55 percent of illegals pay payroll taxes,
comprised of income tax, Social Security, Medicare, and unemployment
insurance. If all of their income were subjected to taxation, illegals'
tax payments would rise significantly. Of course, if they paid all of
their payroll tax liability, this would imply that they have legal
status, which would also dramatically increase use of public services.
This issue will be discussed later in this report.
Excise and Other Taxes. For excise and estate taxes, which are
the most regressive, illegals pay 55 percent as much as other tax
payers. In Table 2, estate and excise taxes are grouped together.
Because illegals are very young on average, they pay very little in
estate taxes. If only excise taxes are considered, the average tax
payment of illegal households is 69 percent that of all households.
Thus, there are significant differences in the relative size of payments
illegals make to the various programs. The more regressive the tax, the
closer the relative payments of illegal households are to the rest of
the population. While the tax payments made by illegal aliens are much
smaller on average than those of other households, illegals still do pay
billions of dollars in taxes to Washington. In 2002, illegal households
paid a total of nearly $16 billion to the federal government. The far
right column in Table 2 shows that illegal alien tax payments constitute
about 0.9 percent of all taxes collected. Because persons in illegal
households constitute 3.6 percent of the nation's total population,
their tax payments are clearly less than their representation in the
population as a whole. This fact by itself does not mean that they
create a fiscal deficit, because the net effect of illegal households on
public coffers also depends on their use of public services, which is
discussed below.
Costs by Household
Social Security and Medicare. The lower half of Table 2 reports
the estimated costs illegals impose on public coffers. The table shows
that, in general, illegal households use much less in almost every type
of service. In the case of Social Security and Medicare, illegal
households use about one-twentieth as much as other households. And they
account for less than two-tenths of 1 percent of the total cost of
these very large programs. Moreover, it is also clear that illegals pay
substantially more in Social Security and Medicare than they use,
creating a net benefit for these two programs of over $1,800 a year per
illegal alien household. This calculation actually understates the
benefit illegals create for the trust funds of these two programs
because Table 2 includes costs for Medicare part B, which is paid for by
general funds. If only Medicare part A (the part of Medicare covered by
the trust fund) and Social Security are considered, illegal households
create a net benefit well in excess of $7 billion dollars a year for the
trust funds of these two programs.
Welfare Programs. Table 2 shows that illegal households
receive much less in cash assistance welfare programs. As already
discussed, persons in illegal households comprise 3.6 percent of the
total population, but their use of cash welfare accounts for 0.3 percent
of costs for these programs. For food assistance programs, however,
illegal households actually receive more of this type of program than
non-illegal households, accounting for 5.6 percent of federal costs for
these programs. This is mainly due to heavy use of the WIC and school
lunch programs. For Medicaid, illegals receive less than other
households, but their use of this very expensive program is still
significant. It's worth noting that although Table 1 showed a larger
share of illegal households using Medicaid, figures in Table 2 show that
on average they receive a lower payment. This mainly reflects the fact
that it is typically only the U.S.-born children in the illegal
households who are on Medicaid, while in other households with low
incomes both parents and children can qualify for the program. Table 2
also shows that illegal use is much lower for all other welfare
programs. But the table still shows that illegal households do use these
programs to some extent.
Other Transfers to Households. For other transfers to
households, the $442 illegal households are estimated to receive is
about half of what non-illegal households get and certainly much less
than their share of the total population. The programs included under
this category are listed at the bottom of the table. Eligibility and use
vary a great deal. For example, illegal aliens who work in the United
States illegally are explicitly allowed to receive the Additional Child
Tax Credit, which pays out a total of $5 billion a year to low-income
workers with children. On the other hand, programs such as student loans
can only be used by the tiny number of citizen children in illegal
households who are enrolled in college. As is the case with most
means-tested programs, illegals use considerably less than other
households, but their use is not zero. Overall, illegal households
account for less than 2 percent of the costs of these programs.
Prisons, Schools, the Uninsured, and Immigration. There are
four areas where the estimated costs illegal households impose are much
larger than for other households--treatment for the uninsured, federal
aid to schools, federal prisons/courts, and the immigration system.
Figures for the uninsured simply reflect the fact that such a large
share of illegal aliens and their children lack health insurance. With
more than half of persons in illegal households lacking health coverage,
illegal households account for a very large share of the costs of
treating the uninsured. As for schools, although they are primarily paid
for by state and local governments, the federal government now provides
more than $28 billion for primary and secondary education. Moreover,
Washington gives schools some assistance in paying for children with
limited English and for the children of agricultural workers. Not
surprisingly, illegal households account for a disproportionate share of
these programs. Illegal households impose very significant costs on the
federal education budget, however, mainly because illegal households
have more school-age children on average. The costs for the federal
prison and court system are also significant because, although persons
in illegal households account for about 3.6 percent of the nation's
total population, illegals now account for almost one-fifth of those in
federal prison and others processed by the federal courts. Thus, they
impose costs on that system that are disproportionally high relative to
their share of the total population. This is also true for the
immigration system. As indicated in the methodology section, the costs
of the immigration system are assigned based on the distribution by
household of post-1980 non-citizens. This probably understates the costs
of illegals to the immigration system because enforcement alone, which
is directed specifically at illegal aliens, accounts for two-thirds of
the immigration budget. Nonetheless, it is certainly not surprising that
illegal aliens account for a large share of the costs of the
immigration system because so much of that system is focused
specifically on them.
Balance of Tax and Cost
Illegals Create Large Net Costs. The bottom portion of Table 2
adds together the total tax payments and costs illegals impose on the
federal budget. When defense spending is not considered, illegal
households are estimated to impose costs on the federal treasury of
$6,949 a year or 58 percent of what other households received. When
defense spending is included, their costs are only 46 percent those of
other households. However, they pay only 28 percent as much in taxes as
non-illegal households. As a result, the estimated net cost per illegal
household was $2,736. Whether one sees this fiscal deficit as resulting
from low tax payments or heavy use of services is a matter of
perspective. As already discussed, illegal households comprise 3.6
percent of the total population, but as Table 2 shows they account for
an estimated 0.9 percent of taxes paid and 1.4 percent of costs. Thus,
both their payments and costs are significantly less than their share of
the total population. Since they use so much less in federal services
than other households, it probably makes the most sense to see the
fiscal deficit as resulting from low tax payments rather than heavy use
of public services.
Total Deficit Created by Illegals. If the estimated net fiscal
drain of $2,736 a year that each illegal household imposes on the
federal treasury is multiplied by the nearly three million illegal
households, the total cost comes to $10.4 billion a year. Whether one
considers this to be a large sum or not is, of course, a matter of
perspective. But, this figure is unambiguously negative and certainly
not trivial. It is also worth remembering that these figures are only
for the federal government and do not include any costs at the state or
local level, where the impact is likely to be significant.
The Fiscal Implications of Amnesty
So far we have only considered the current fiscal impact of illegal
alien households. In the following section we run two different
simulations to estimate what would happen if illegal aliens in the
United States were legalized. We assume that any amnesty that passes
Congress will have Legal Permanent Residence (LPR, colloquilly known as a
"green card") as a component. It is true that President Bush's amnesty
proposal in January 2004 envisioned temporary worker status for illegal
aliens. At present, however, every major legalization bill in Congress
provides illegals with LPR status at some point in the process.
Moreover, because Republicans are divided between those favoring
enforcement of immigration laws and those who want an amnesty, any
legalization must have significant Democratic support to pass. But
Democrats have made clear than they can only support an amnesty that
gives permanent residence. While a two-step legalization -- one that
grants temporary status before permanent residence -- is certainly
possible, such a system would still result in permanent residence.
Politically, it seems almost certain that any amnesty that actually
passes Congress will award LPR status to illegals. But even if one makes
the very unlikely assumption that an amnesty will be a pure guestworker
program, the net fiscal deficit imposed by illegals indicates that
unskilled workers who are not permanent residents still create large
fiscal costs. As we have seen, this is partly because of their U.S.-born
children, partly because like all people they necessarily place some
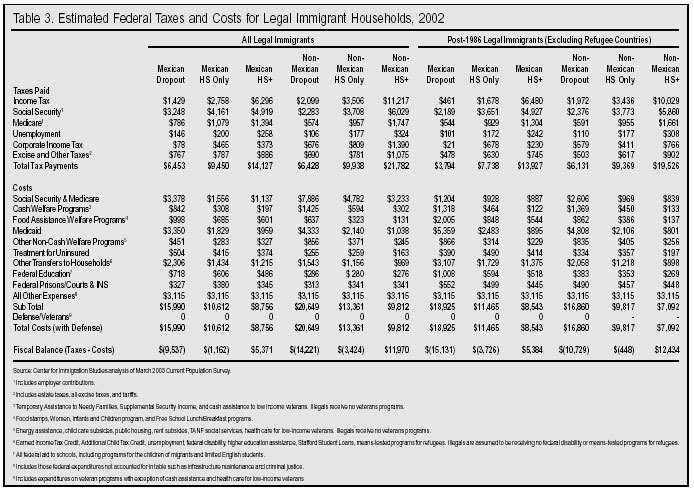
demands on government, and partly because their low-income results in
very low tax payments. All these things would still be true of unskilled
guest workers.
General Impact of Amnesty. It is important to consider the
likely outcomes of any amnesty: First, there should be a significant
increase in tax compliance. (In the simulations below we assume that
compliance rises from 55 percent to 100 percent.) Second, the average
income of illegals should rise, as they would be freer to make decisions
about employment and less likely to be exploited by employers. Third,
use of public services will increase as the now-legal immigrants are
eligible for many services from which they were barred as illegals. The
actual size of these changes and their impact on the fiscal bottom line
are explored below. It is also very important to realize that, if
legalized, illegal aliens would not simply become just like legal
immigrants in general because illegals are much less educated on average
than legal immigrants. To run our legalization simulations we use the
characteristics of illegals who are household heads and then assume that
if they were legalized, they would pay taxes and use services like
legal immigrant households headed by persons with the same
characteristics.
Simulation One. We first report the education levels and
country of birth of illegal households based on the education and
country of the household head. Figure 1 reports the Mexican and
non-Mexican share by education level of the illegal alien population. We
divide illegals by their education level because, as already discussed,
the single most important determinant of one's income, and thus service
use and tax payments, is education. This was one of the most important
conclusions of the aforementioned NRC study. We further divide them by
whether they are Mexican because all research, including this report,
indicates that about 60 percent of illegals are from that country.
Moreover, the NRC study found significant differences between households
headed by Latin American immigrants and those from the rest of the
world. Figure 1 reports the distribution of illegal alien household
heads by their educational attainment and if they are Mexican. We then
assume that if illegals were legalized they would use services and pay
taxes like all legal immigrants with the same characteristics.
32
 Simulation Two.
 In the second simulation we again divide the
illegal population by education and whether they are Mexican, but this
time we assume that they would pay taxes and use services like legal
immigrants who arrived in 1986 or after. That is, we again use the
results from Figure 1 and assume that if legalized, they would use
services and pay taxes like legal immigrants who have the same
characteristics, but have arrived since 1986. The reason we assume that
they would be like post-1986 legal immigrants is that illegals
themselves are almost all post-1986 arrivals, the year the last amnesty
for illegals was passed. Illegals are much more like recently arrived
legal immigrants then they are like legal immigrants in general, who are
older and have higher income but also use programs like Social
Security. In addition, we exclude persons from the main refugee-sending
countries because it is well established that refugees have the highest
rates of public benefit receipt of any group of immigrants. These
countries include: Poland, the former Yugoslavia, the Former Soviet
Union, Afghanistan, Cambodia, Iraq, Laos, Vietnam, Nicaragua, Cuba, and
Ethiopia. This second simulation is probably the most plausible.
Fiscal Impact of Legal Immigrants. Table 3 shows estimated
federal taxes paid and services used in 2002 for legal immigrant
households by education level and whether a person is from Mexico. The
left side of the table is the basis for Simulation 1 and shows all legal
immigrants regardless of when they arrived; the right side of the table
shows the same figures for post-1986 non-refugees. One interesting
finding of the table is that estimated tax payments are higher for all
categories of legal immigrant households than the roughly $4,200 paid by
illegal households in Table 2. The only exception is for post-1986
Mexicans without a high school education. Thus, those who contend that
legalization would increase tax revenues are probably correct. Almost
every category of legal immigrant pays more in taxes than do illegal
households. Unfortunately, the table also shows that, in every case,
total federal costs are also higher than the roughly $6,900 a year
reported for illegal households in Table 2. Thus, those who are
concerned that legalization would increase costs are also almost
certainly correct.

(Click on Table for a larger version)
As expected, Table 3 shows that there is very wide variation in
public service use and tax payments between groups. Overall service use
and tax payments by household closely correlates with education levels
of household heads. In both simulations, those with more than a high
school degree are a large net fiscal benefit to the federal government,
while those with only a high school education or less are a net fiscal
drain. This is true whether the legal immigrant is from Mexico or not.
It is also true whether one considers all legal immigrants or only
post-1986 non-refugees. The difference between immigrants by education
is truly enormous. For example, looking at households headed by
post-1986 non-refugees, a legal immigrant without a high school degree
creates a fiscal deficit on the federal government of more than $15,000 a
year if he is Mexican and almost $11,000 if he is from the rest of the
world. Conversely, for those with more than a high school degree, the
benefit is over $5,000 a year if they are Mexican and more than $12,000
for non-Mexicans. The same pattern holds when all immigrant households
are considered, regardless of year of arrival. Without question, the
education level of legal immigrants is a key determinant of their fiscal
impact. However, being from Mexico seems to matter as well.
Legalization Would Dramatically Increase Costs. Using the
education levels and the share that is Mexican found in Figure 1 and
combining them with the results from Table 3, we can then estimate the
likely impact of legalization. Table 4 reports the estimated federal
taxes paid and services used by legalized illegal alien households
assuming they would pay taxes and use services like households headed by
legal immigrants with the same characteristics. The first simulation
assumes that illegals would pay federal taxes and use services like all
legal immigrants with the same education level, regardless of when they
arrived, while the second simulation assumes that they would have the
impact of post-1986 legal non-refugee immigrants. Both simulations show
that legalization would increase the net fiscal costs dramatically.
Simulation 1 shows that the net fiscal costs to the federal government
would increase from $2,736 to $6,022 per household. Simulation 2 shows
the net fiscal cost would be even larger, increasing to $7,668 per
household. Although net costs rise, estimated tax payments increase
dramatically with legalization. They more than double in Simulation 1
and increase by 77 percent in Simulation 2. However, costs rise
significantly as well. In both cases costs more than double, creating an
average net fiscal deficit per household that is significantly more
than that estimated for illegal alien households.

Interestingly, total costs per household are roughly the same in both
simulations. In Simulation 1, legal immigrants are making significantly
more use of Social Security and Medicare, while in Simulation 2 use of
welfare, education, and other transfers to households are much higher.
This reflects the different age structure of post-1986 immigrants
compared to all immigrants. In effect, one can see Simulation 2 as the
more immediate impact of a legalization, while Simulation 1 reflects the
likely fiscal impact of legalized aliens in the long term. Either way,
the results indicate that legalization would cause the net fiscal burden
on taxpayers to increase substantially. It should be noted that,
although legalization would substantially increase costs, this does not
mean that legal immigrants overall are net drain on the federal
government. It also worth noting that if only the relatively small share
of illegal aliens with more than a high school degree were legalized,
then there would be no fiscal deficit. But since so many illegals have
only a high school degree or less, legalizing all illegals would create a
large fiscal deficit.
Would Welfare Reform Hold Down Amnesty Costs? In 1996,
Congress passed the Personal Responsibility and Work Opportunity
Reconciliation Act (PRWORA), which barred some legal immigrants who
arrived after 1996 from using certain welfare programs. Since many legal
immigrants used in Simulation 2 to estimate the costs of amnesty
arrived before 1996, perhaps our estimates overstate the costs, at least
with regard to welfare programs. Table 5 provides a detailed breakdown
by program for all of the costs estimated in this study. The table shows
that legalization under Simulation 2 would increase costs by a total of
$8,173 per household. (The same total found in Table 4) Of that
increase, $5,588, or about 68 percent, is the result of increased costs
due to cash payments from TANF, SSI, and in-kind benefits received from
food stamps and Medicaid, the four main programs covered by PRWORA.
While certainly a large share of the costs, it still leaves an increase
of $2,585 per household in non-PRWORA covered programs.

More importantly, analysis of the CPS shows that households headed by
recently arrived legal immigrants actually do make significant use of
these welfare programs. Table 6 reports estimated use of these four
programs for households headed by legal immigrants from Mexico and the
rest of the world, excluding refugee countries. The table shows that, in
2002, households headed by a legal immigrant from Mexico who arrived in
1996 or later and who lacks a high degree received $7,900 on average
from these four programs and those with only a high school degree
received $3,817.
33
For post-1996 households headed by legal non-refugees from countries
other than Mexico without a high school degree, the figure is $5,464 per
household, and for those with only a high school degree the figure is
$2,462. By contrast, the figure for illegal aliens is only $860 per
household.

Table 6 also shows that if we assume that illegal households, once
legalized, would use welfare like non-refugee legal immigrants who
arrived in 1996 or later with the same education, then welfare costs
would be $5,430 per household, very similar to the $5,588 in Simulation
2. It must be remembered that, as originally shown in Table 3, legal
immigrants with little education make very extensive use of welfare
programs because their incomes are very low and because they receive
these programs on behalf of their U.S.-born children. This is especially
true for Medicaid, by far the costliest program. Welfare reform has not
changed these basic facts. Given this reality, it is very difficult to
see how a dramatic rise in welfare costs could be avoided if there was a
legalization.
Amnesty Would Increase Incomes. Although the net fiscal burden
would increase dramatically as a result of a legalization, this does
not mean that the income of illegals would remain unchanged. Table 4
shows a dramatic increase in payroll taxes and this partly reflects
increases in household income that would occur if illegals were
legalized. In fact, analysis shows that whether they are Mexican or not
and no matter what their educational attainment, legalization would
significantly increase the income of illegal aliens. Figure 2 reports
the estimated income of legalized illegal households under Simulations 1
and 2. Like the estimates in Table 4, they are based on the assumption
that, if legalized, illegal households would have average incomes like
their legal counterparts controlling for whether the household head is
Mexican and for education levels. Under Simulation 1, their income would
be 29 percent higher, and under Simulation 2 incomes are 15 percent
higher. Of course, the much higher incomes in Simulation 1 partly
reflect the longer time that all immigrants have lived in the United
States and not simply the fact that they have legal status. But
Simulation 2 shows that even when analysis is confined to more recent
arrivals, incomes still increase substantially. While our overall
conclusion indicates that legalization would increase fiscal costs,
perhaps the improvement in the income and economic well being of illegal
households could be used to justify legalization. Certainly, Figure 2
indicates illegals would likely benefit significantly from obtaining
legal status.
 Comparisons to Other Studies
There is always some uncertainty associated with any fiscal estimate of
immigrants, especially illegal aliens. However, the overall results of
this study are consistent with other work that has looked at this
question.
NRC Study. As mentioned at the beginning of this report, the
1997 study by the National Research Council (NRC) is probably the most
sophisticated report ever to examine the impact of immigration on public
coffers in the United States. While that report did not consider the
legal status of immigrants, it did divide immigrants by education. The
overall findings of that report showed that the education level of
immigrants was critically important in determining their income, tax
payments, service use, and resulting net fiscal impact. They found that
during his lifetime an immigrant without a high school education imposed
a net fiscal drain on taxpayers of $89,000; for those with only a high
school degree it was $31,000. The NRC study also found that for those
immigrants with more than a high school degree the fiscal benefit was
$105,000. While we report estimates for only legal immigrants for a
single year, our analysis by education found in Table 3 is strongly
supported by the NRC's findings.
Urban Institute Study of New York State. One of the few
studies to specifically estimate illegal immigrant tax payments at the
federal level by household was done by the Urban Institute in 1998. That
study used the CPS to estimate 1994 tax payments for illegal households
in New York State, including some federal taxes. Although our study is
designed to measure the fiscal impact of immigration at the national
level, we ran separate estimates for federal tax payments for
illegal-headed households in New York State so we could compare them to
those of the Urban Institute. The Urban Institute only examined federal
income tax, Social Security, and unemployment insurance, and we did the
same. We estimated that the average illegal household in New York State
paid $5,538 in these three taxes in 2002, compared to $4,568 estimated
for tax year 1994 by the Urban Institute. Adjusted for inflation between
1994 and 2002, this is $5,463 or only 1.4 percent less than our
estimate for 2002.
34
Of course, illegal immigration to New York State and the federal tax
code has changed since 1994. Nonetheless, our average estimates are very
similar to those developed by the Urban Institute when adjusted for
inflation.
Treasury Department Report. The results of our study are also
buttressed by an analysis of illegal alien tax returns done by the
Inspector General's Office of the Department of Treasury in 2004.
35
That study found that 55 percent of illegal aliens who filed income tax
returns using tax identification numbers had no federal income tax
liability. While higher than the 45 percent estimated in this study, it
must be remembered that this figure was only for those who filed tax
returns using a tax identification number. These are all individuals who
expected refunds, otherwise they would not have gone to the trouble of
getting tax identification numbers and filing a return. But like our
estimates, the Inspector General's report indicates that roughly half of
illegals have no tax liability, reflecting their very low incomes and
large number of dependents.
Conclusion
It is often suggested that "matching a willing worker with a willing
employer" is all that matters when it comes to immigration policy. The
fiscal costs of illegal immigration indicate that focusing only on
workers and employers is grossly inadequate. If the presence of large
numbers of unskilled workers lowers prices for some goods and services,
but at the same time increases the burden on taxpayers, then this may
not be a good deal for the country. Put simply, the mere fact that
employers want more workers, and foreigners wish to work in this
country, does not mean that Americans necessarily benefit from their
coming. This fact must be considered when formulating policy.
Low Levels of Education Create Deficit. The findings of this
study show that the primary reason illegal households create a fiscal
deficit at the federal level is that their much lower levels of
education result in low incomes and tax payments that are only 28
percent that of other households. Thus, even though the costs they
impose are estimated to be only 46 percent those of other households on
average, there remains a significant net deficit. Whether one considers
their use of services low is a matter of perspective. Because illegals
are not even supposed to be in the country, many Americans are angered
by the fact that they receive any services at all. This is especially
true of transfers to households like food stamps or cash payments from
the Child Tax Credit. Although many Americans are upset about their use
of public services, there is little evidence that illegals come to
America to take advantage of public benefits. Most illegal aliens come
for jobs, and the vast majority are in fact employed. But low levels of
education mean they unavoidably create large costs for taxpayers.
As Long as Illegals Remain, So Will Costs. The relatively low
receipt of services by illegals is important from a policy perspective
because it means that the amount of money that can be saved by further
efforts to curtail their use of public services is probably very
limited. As already discussed, the average illegal household is
estimated to receives less than half as much in services from the
federal government as do other households, even though their households
are 17 percent larger on average. This, coupled with the fact that
benefits are often received on behalf of their U.S.-born children who
are awarded citizenship at birth under current law, means that it is
very difficult to avoid many of the costs as long as the illegal aliens
remain in the country. In addition, if they are allowed to stay, most of
the costs they impose will be for programs whose use is difficult to
prevent politically or as a practical matter. For example, denying
illegals benefits such as the Women, Infants, and Children nutrition
program might encounter significant political opposition. And
incarcerating illegals who have been convicted of crimes is an
unavoidable cost of having a large illegal population. Thus, if we want
to avoid the costs, we must look to alternatives other than trying to
cut them off from public services.
Amnesty Would Dramatically Increase Costs. One of the key
findings of this report is that legalization would dramatically increase
the costs of illegal immigration. If illegals were given green cards
and began to pay taxes and use services like legal immigrants with the
same education levels, the net annual fiscal deficit at the federal
level would likely increase from $2,736 to $7,668 per household under
the most likely scenario. Total costs could grow from $10.4 billion a
year to $28.8 billion. The costs increase dramatically because unskilled
immigrants with legal status, which is what most illegal aliens would
become, can access government programs but still tend to make very
modest tax payments. This is because the modern American economy offers
very limited opportunities to those with little education, regardless of
legal status. Though we estimate that household income might rise by 15
percent with legalization and average tax payments would increase by 77
percent as more illegals would be paid off the books, their average
household incomes would still remain one-third below that of other
households. At the same time, service use would rise dramatically
because legal immigrants are eligible for most programs, and they
typically have much less fear about using them than illegal aliens. This
does not mean that low-income legal immigrants use more in services
than low-income native-born Americans. The fiscal deficit is created by
the fact that so many illegal aliens are unskilled and thus have low
income.
What's Different About Today's Immigration. Many native-born
Americans observe that their ancestors came to America and did not place
great demands on government services. Perhaps this is true, but the
size and scope of government was dramatically smaller during the last
great wave of immigration -- not just means-tested programs, but
expenditures on public schools and roads were only a fraction what they
are today. Thus the arrival of unskilled immigrants in the past did not
have the negative fiscal implications that it has today. Moreover, the
American economy has changed profoundly since the last great wave of
immigration, with education now the key determinant of economic success.
The costs that unskilled immigrants, or unskilled natives for that
matter, impose should not be seen so much as a failings on their part,
but instead as a reflection of the nature of the modern American
economy. Put simply, large-scale unskilled immigration is incompatible
with current economic conditions and an extensive welfare state. If the
fiscal costs are to be avoided, then our immigration policies need to
reflect current fiscal and economic realities and the number of
unskilled immigrants, legal or illegal, should be reduced.
The Bottom Line. This report has focused on only the fiscal
impact of illegal aliens at the federal level. It is almost certain that
they also create a large fiscal deficit at the state and local levels.
36
Thus, the results in this report only deal with part of the costs of
illegal immigration. On the other hand, it must be remembered that this
report says nothing about the overall fiscal impact of households headed
by legal immigrants. The fact that unskilled immigrants who are legal
residents impose large fiscal costs on federal coffers does not mean
that legal immigrants overall are a drain on federal coffers. Many legal
immigrants are highly skilled. That having been said, we find strong
and convincing evidence that the costs of illegal immigration are
significant at the federal level and those costs would grow dramatically
if illegals were legalized. Of course, there are many other issues to
consider when deciding what do to about illegal immigration. But given
the costs of illegal aliens and of any amnesty, it would probably make
more sense to enforce immigration laws and reduce illegal immigration.
Reducing the supply of unskilled labor would force employers to increase
wages and invest in labor-saving devices in order to meet their labor
needs.
If we instead chose to increase the number of unskilled workers in
the country through immigration, then we at least have to understand
that such a policy has negative fiscal consequences. Perhaps legalizing
illegal aliens may be justified on humanitarian grounds, or as a way to
improve relations with other countries. Conversely, enforcement might
make more sense because it reduces job competition for unskilled
Americans, or for national security reasons. But this analysis shows
that, at least with regard to the federal budget, there is a high cost
to unskilled illegal alien labor and this must be part of any policy
discussion.
Appendix
Appendix Table 1 Appendix Table 5
Appendix Table 2 Appendix Table 6
Appendix Table 3 Appendix Table 7
Appendix Table 4


End Notes
1 The National Research Council report
entitled, "The New Americans: Economic, Demographic, and Fiscal Effects
of Immigration" can be ordered or read online at
http://www.nap.edu/books/0309063566/html
2The Urban Institute study is entitled
"Immigrants in New York: Their Legal Status, Incomes, and Taxes," by
Jeffrey S. Passel and Rebecca L. Clark. A summary of the report can be
found at
http://www.urban.org/url.cfm?ID=407432
3The Florida study was conducted by the
University of Florida and is entitled, "Facts about Immigration and
Asking Six Big Questions for Florida and Miami-Dade." Information about
the study can be found at
http://www.bebr.ufl.edu/Articles/bosmig.pdf.
The 1997 study of New Jersey is entitled "State and Local Fiscal
Impacts of New Jersey's Immigrant and Native Households," and can be
found in the edited volume "Keys to Successful Immigration: Implications
of the New Jersey Experience," edited by Thomas J. Espenshade, Urban
Institute Press. Washington DC. The Center for Immigration Studies study
is entitled "The Costs of Immigration: Assessing a Conflicted Issue,"
by David Simcox, John Martin, and Rosemary Jenks.
4The survey is considered such an accurate
source of information on the foreign-born because, unlike the decennial
census, each household in the CPS receives an in-person interview from a
Census Bureau employee. The 217,000 persons in the Survey, 23,000 of
whom are foreign born, are weighted to reflect the actual size of the
total U.S. population. However, it must be remembered that some
percentage of the foreign born (especially illegal aliens) are missed by
government surveys of this kind, thus the actual size of this
population is almost certainly larger. The CPS data used in this study
was provided by Unicon Research.
www.unicon.com
5This includes naturalized American
citizens, legal permanent residents (green card holders), illegal
aliens, and people on long-term temporary visas such as students or
guest workers, but not those born abroad of American parents.
6We supplement this data, where needed,
with estimates derived from the 2000 Census because the Census contains
several important pieces of information not found in the CPS, such as if
a person speaks English well. We use this data to apportion the costs
of providing for students who have limited English. The CPS, in
contrast, does not ask a question about language.
7 Tables from the OMB showing taxes collected by source and year can be found at
http://www.whitehouse.gov/omb/budget/fy2004/hist.html
8 "Cash and Noncash Benefits for Persons
with Limited Income: Eligibility Rules, Recipient and Expenditure Data,
FY2000-FY2002," November 25, 2003. RL32233. Complied by Vee Burke.
9 Federal expenditures on primary and
secondary education programs come from the Census Bureau report,
"Federal Aid to States for Fiscal Year 2002," which can be found at
http://www.census.gov/prod/2003pubs/fas02.pdf.
Expenditures on Social Insurance Programs (Social Security, Medicare,
and Unemployment Compensation) come from the OMB's web site,
http://www.whitehouse.gov/omb. Figures for non-citizens in federal prisons come from the Federal Bureau of Prisons web site,
http://www.bop.gov/fact0598.html#Population. The INS 2002 budget comes from the Department of Justice web site and can be found at:
www.usdoj.gov/jmd/budgetsummary/btd/1975_2002/2002/html/page104-108.htm
10 Since all of the costs are controlled
to the actual total taxes collected and total expenditures, our method
has the effect of controlling for the undercount of illegal aliens,
legal immigrants, and even natives.
11 The INS report that estimated seven million illegals in 2000, with an annual increase of about 500,000, can be found at
http://uscis.gov/graphics/shared/aboutus/statistics/Illegals.htm. The Census Bureau report with an estimate of eight million illegals in 2000 can be found at
www.census.gov/dmd/www/ReportRec2.htm
(Appendix A of Report 1 contains the estimates). The Urban Institute is
the only organization to release figures for the size of the illegal
population based on the CPS. Urban estimates that, in March of 2002, 8.3
million illegal aliens were counted in the CPS, with an additional one
million being missed. Assuming continual growth in the CPS, there were
between 8.6 and 8.8 million in the March 2003 CPS. Urban's estimates
based on the March 2002 CPS can be found at
http://www.urban.org/url.cfm?ID=1000587. Additional information was provided by Jeffery Passel of the Urban Institute in a May 24, 2004, telephone interview.
12 The fact that our results match those
from the Urban Institute is not an accident because the probabilities
assigned to variables such as citizenship status, year of arrival in the
United States, country of birth, or any of the other variables
discussed above, are designed to match the results of previous research
in this area.
13 "The New Americans," pp. 255-256.
14 "Keys to Successful Immigration: Implications of the New Jersey
Experience," p. 143.
15 The NBER paper, authored by David E. Weinstein and Donald R. Davis, can be found at
www.columbia.edu/~drd28/Migration.pdf.
16Actual taxes collected by source can be found at OMB's web site,
http://www.whitehouse.gov/omb
17 A detailed discussion of how the
Census Bureau estimates tax payment can be found in Census paper
P60-186RD, "Measuring the Effect of Benefits and Taxes on Income and
Poverty: 1992."
18 In the case of Social Security,
estimated tax payments from the Census Bureau are roughly doubled to
reflect employer contributions.
19 See David North and Marion F.
Houstoun, "Characteristics and Role of Illegal Aliens in the U.S. Labor
Market," 1976, Washington, D.C.: Linton and Co.; and Louis Rea and
Richard Parker, "Illegal Immigration in San Diego Country: An Analysis
of Costs and Revenues," 1992. Report to the California State Senate
Special Committee on Border
Issues.
20 "Immigrants in New York: Their Legal
Status, Incomes, and Taxes;" "Undocumented Immigrants in New Jersey:
Numbers, Impacts and Policies" in "Keys to Successful Immigration:
Implications of the New Jersey Experience." Edited by Thomas Espenshade,
1997, Washington, D.C.: Urban Institute Press.
21 Although the CPS does not specifically
ask about the breakfast program, we assign costs for this program to
households based on use of the lunch program.
22 The Treasury Department Inspector General for Tax Administration report, # 2004-30-023, can be found at
http://www.treas.gov/tigta/2004reports/200430023fr-redacted.html
23 There are two ways an illegal alien
could have a Social Security number that allows him to file a return and
get the EITC: First, a stolen or otherwise aquired number and matching
name from someone authorized to work in the United States. Second, some
illegal aliens have been issued Social Security numbers. This can
include illegal aliens who have an application pending with the
immigration service, such as asylum applicants. Even thought the
individual is illegally in the country and the application has only a
small chance of ever being approved, some are still given work
authorization. As IRS publication 596 states (page 6), Social Security
numbers that are "Valid for Work only with INS authorization" can
receive the EITC. The person need not be a legal resident of the United
States. While it is unknown how many illegal immigrants have illegally
acquired Social Security numbers, the number is likely to be
significant. If roughly half of the 5.7 million illegals in the 2003 CPS
who hold jobs are paid on the books, then this means that roughly three
million illegals have provided employers with a SSN or perhaps an
Individual Taxpayer Identification Number (ITIN) that was accepted. The
ITIN is not supposed to be used by employers to pay payroll taxes, but
this restriction may not be completely enforced.
24 In a February 2003 study in Health Affairs, which can be found at
http://www.healthaffairs.org,
Hadley and Holahan estimated that the federal government spent $19.9
billion for the uninsured in 2001. An updated study for the Kaiser
Family Foundation, which can be found at
http://www.kff.org,
estimated the figure was $23.5 billion in 2004. To estimate costs in
2002, we assume a constant rate of growth of 5.7 percent between 2001
and 2004, meaning that federal expenditures totaled $21.03 billion in
2002. Hadley and Holahan's two studies indicate that care provided
directly by the federal government, such as the VA, increased at an
annual rate of 2.4 percent. As a result, we estimate that veterans
expenditures in 2002 were $3.98 billion.
25 This is based on the assumption that
the costs of administering the INS in 2002 were due to the presence of
immigrants in the country either as legal immigrants who need a variety
of services or as illegal aliens who are the subject of enforcement.
26 We also use statistics for the Coast Guard interdiction program which can be found at
http://www.uscg.mil/CG_2004_html/goals.html#migrant
27 According to the Justice Department,
non-citizens comprised 28.8 percent of the federal prison population in
2002. Figures can be found at
http://www.bop.gov/fact0598.html#Citizenship.
An unpublished paper by Rebecca Clark and Scott Anderson from the Urban
Institute, entitled "Illegal Aliens in Federal, State, and Local
Criminal Justice Systems," indicated that 57 percent of non-citizens in
1996 were illegal aliens and the share was increasing by 0.4 percentage
points a year in the mid-1990s. Thus, by 2002, about 59 percent of
non-citizens were likely illegal aliens. This means that 23,000
(22,978), or 17 percent, of the federal prison population were illegals.
When later in this report we estimate costs for households headed by
legal immigrants we assume that 11.8 percent (28.8 percent - 17 percent)
of non-citizens in federal prisons are legal immigrants, and 4.5
percent of the federal prison population are naturalized U.S. citizens,
which is their share of the nation's total population. This means that
16 percent of federal prisoners are legal immigrants (naturalized and
unnaturalized).
28 Information on those in federal courts can be found in the Compendium of Federal Justice Statistics:
http://www.ojp.usdoj.gov/bjs/abstract/cfjs01.htm
29 The costs of the federal court system can be found at
http://www.uscourts.gov/ttb/mar03ttb/budget.html
30 See Appendix F in "Measuring the
Effect of Benefits and Taxes on Income and Poverty: 1992" from the U.S.
Census Bureau for a discussion of under-reporting of income and receipt
of redistribution programs.
31 Footnote 32 on page 278 of the NRC
report indicates that households that received redistribution programs
like Social Security are identified in the CPS and then assigned the
average benefit level. This would seem to control for under-reporting.
32 Although we included them in the costs
for non-illegal households in Table 2, we exclude costs for the small
number of federal programs that specifically aid refugees because if
legalized, illegals should not access these programs.
33 These recently arrived unskilled legal
immigrants are relatively small in number and so the survey should be
interpreted with some caution, but in the case of both Mexicans and
non-Mexicans, use of welfare programs by recently arrived unskilled
immigrants (excluding refugees) is quite high.
34 Table 6 on page 103 of the Urban Institute study has the estimates by type of tax.
35 The Inspector General's Office of the Department of the Treasury report # 2004-30-023 can be found at
http://www.treas.gov/tigta/2004reports/200430023fr-redacted.html
36 Although they did not look at illegals
separately, the NRC study found that in California and New Jersey (the
two states they examined) immigrants from Latin America and the
Caribbean, where the vast majority of illegals come from, were a
significant fiscal drain. By using Census Bureau data that include both
illegals and legals, their fiscal analysis is really a combined estimate
of the entire foreign-born population both legal and illegal.