
Randall Hill | Reuters
It's the economy, stupid.
That was how Bill Clinton singled out economic conditions as the most important issue in his 1992 presidential election campaign. Eight years earlier, candidate Ronald Reagan asked: "Are you better off now than you were four years ago?"
Today, some eight years after the worst financial collapse since the Great Depression, the nation's economy is once again central to both parties' appeal to voters.
For presumptive GOP nominee Donald Trump, that means tapping into the financial anxiety weighing on middle-class voters. "It's not just the political system that's rigged, it's the whole economy," he told supporters in New York last month. "It's rigged against you, the American people.
Harkening back to the booming economy of the 1990s during the Clinton administration, presumptive Democratic nominee Hillary Clinton said in May that she would put her husband "in charge of revitalizing the economy ... Because, you know, he knows how to do it."
For his part, President Barack Obama has vigorously defended his economic record over the last eight years.
"Anybody who says we are not absolutely better off today than we were just seven years ago — they're not leveling with you," he said in February. "They're not telling the truth. By almost every economic measure, we are significantly better off."
As American voters measure candidates based on how well off they feel and how confident they are about the future, CNBC.com analyzed the economic records of the last six presidents to better assess their performance. We looked at a variety of measures, calculating the net change from the start of a president's term to the end, beginning with Jimmy Carter's inauguration in January 1977.
Here are a dozen charts showing what we found.

With six months left before Obama leaves office,
the overall economy continues to expand — slowly. As of the first
quarter of this year, the U.S. economy is nearly 15 percent bigger than
when the president took office in 2008, adjusted for inflation.
That gain is slightly less than his predecessor, George W. Bush, and roughly half the GDP gain in percentage terms during the Reagan administration.
Carter, who served only one four-year term, produced an impressive 12 percent economic expansion. If Carter had been re-elected and kept up that growth pace, he would have had the third-best performance among the six presidents in our analysis. But Carter left office in the middle of a double-dip recession, a major reason for his defeat to Reagan in 1980.
George H.W. Bush, the other one-termer in our analysis, left office with only an 8 percent gain in GDP.
The biggest expansion of GDP came under Clinton, who presided over the 1990s boom; when he left office in 2000, the economy was nearly 35 percent bigger than when he moved into the White House in 1993.

Not surprisingly, the presidents' records on job
growth stack up roughly the same. During the Clinton administration,
total payrolls grew by nearly 21 percent, slightly better than Reagan's
17 percent gain. The Carter administration had the third-best record,
boosting payrolls by 12 percent. If he had kept that up for a second
term, he would have topped the list of job creators. Both Bushes
produced the smallest gains.
The Obama administration, which began in the midst of massive layoffs from the Great Recession, has presided over a job market turnaround. Overall employment is about 7 percent higher than when he took office.
The Obama administration, which began in the midst of massive layoffs from the Great Recession, has presided over a job market turnaround. Overall employment is about 7 percent higher than when he took office.

But those jobs gains are only one measure of the
health of the labor market. Since the 1990s, many Americans workers have
left the labor force for a variety of reasons. Some are boomers who
have retired; others have become so discouraged looking for a job that
they've given up.
After steady gains during the Carter, Reagan and first Bush administration, the labor force participation rate peaked during the Clinton administration and has been declining since, with the steepest losses coming during the Obama years.
After steady gains during the Carter, Reagan and first Bush administration, the labor force participation rate peaked during the Clinton administration and has been declining since, with the steepest losses coming during the Obama years.

Second to having a job, American workers are most
concerned about wages, which have stagnated during much of the recovery
from the Great Recession. In real terms (adjusted for inflation), hourly
compensation saw the biggest gains during the Clinton-era '90s boom,
followed by the 1980s expansion under Reagan. The second Bush
administration had the third-strongest showing, followed by the Obama
administration, which has seen the fastest wage gains during his second
term.
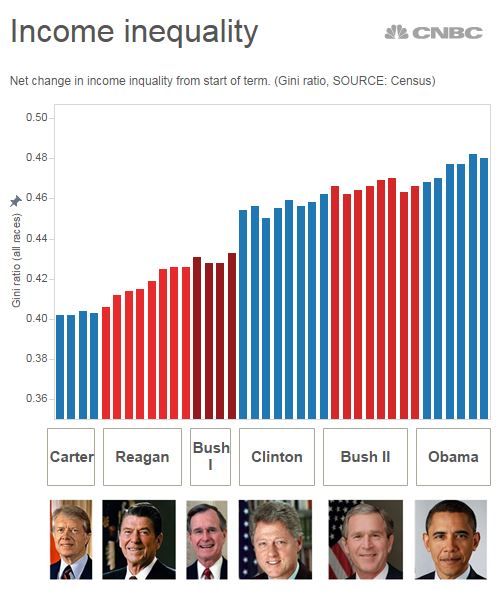
Stagnant wages have also widened the gap between
the rich and poor, a major issue in political campaigns at all levels of
government. That gap, as measured by the Gini ratio,
a widely used measure of income distribution, began rising during the
Reagan administration. Despite the Obama administration's focus on
closing the income gap, it has continued to expand under his watch.

Economic well-being has traditionally involved
homeownership, a dream that was shattered for many with the collapse of
the housing market in 2008. The last major downturn in housing dated to
the Bush I administration, following the collapse of the savings and
loan industry that had provided mortgages to American families for
generations.
Home sales peaked in 2005 during the middle of the Bush II administration and bottomed early in Obama's first term. Sales have since recovered, but are still at levels not seen since the early 1990s when Bush I was leaving office.
Home sales peaked in 2005 during the middle of the Bush II administration and bottomed early in Obama's first term. Sales have since recovered, but are still at levels not seen since the early 1990s when Bush I was leaving office.
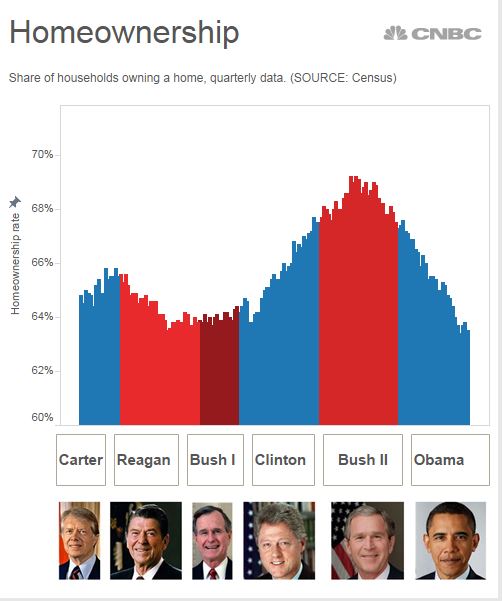
The housing crash also sent homeownership rates
plunging, erasing the gains during the Bush I and Clinton
administrations. Despite a recovery in the housing market and
historically low mortgage rates, the homeownership rate has continued to
fall during the Obama administration to levels not seen since the
Carter era.

Presidents are also judged for their management
of taxpayers' money, and federal spending has become a major issue in
recent presidential campaigns. Measured as a share of the overall
economy, spending remained relatively steady — ranging from 18 to 22
percent of GDP — during the Carter, Reagan and Bush I administrations.
Thanks to a booming economy in the 1990s, spending as a share of GDP fell during the Clinton administration but began rising again under Bush II. When the Great Recession sent the economy in reverse, spending as a share of GDP soared when Obama took office, but has come back in line with historical trends since then.
Thanks to a booming economy in the 1990s, spending as a share of GDP fell during the Clinton administration but began rising again under Bush II. When the Great Recession sent the economy in reverse, spending as a share of GDP soared when Obama took office, but has come back in line with historical trends since then.

Obama has also presided over some of the biggest
budget deficits in the last four decades, in part because of massive
stimulus spending aimed at heading off an even deeper downturn. Of the
six presidents, only Clinton returned a budget surplus during his last
years in office, helped in part by a windfall of tax receipts from the
dot-com investment bubble.

Those big Obama deficits also added substantially
to the pile of public debt outstanding, which now stands at roughly 100
percent of GDP. But the pile has been growing for 40 years. The level
of public debt as a share of GDP roughly doubled during the Reagan and
Bush I administrations, then fell during the Clinton era and began
rising again under Bush II.

The strength of the economy can also be measured
by the health of the private sector, which presidential candidates
typically rely on for campaign contributions.
Based on one measure — total after-tax corporate profits — Bush II stands out. During his administration, profits soared, only to come crashing back with the collapse of the financial system. Profits were 36 percent higher at the end of his term, compared with 47 percent gains during the Clinton administration and 62 percent under Obama's watch.
Profits rose roughly 25 percent under Reagan and Bush I; they were up 37 percent under Carter.

For stock market investors, Democrats have clearly outperformed Republicans in the White House over the last 40 years.
The Standards & Poor's 500 index rose 150 percent during the Clinton administration; under Obama, stock prices have been rising by 100 percent. (We're using Yale economist Robert Shiller's inflation-adjusted data.)
Those gains compare with net losses of 45 percent under Bush II, gains of about 30 percent under Bush I, and a 50 percent gain under Reagan. Stock prices lost about 13 percent of their value during the Carter administration.

No comments:
Post a Comment