Authored by Aaron Ginn via Medium.com,
After watching the outbreak of COVID-19 for the past two months, I’ve
followed the pace of the infection, its severity, and how our world is
tackling the virus. While we should be concerned and diligent,
the situation has dramatically elevated to a mob-like fear spreading
faster than COVID-19 itself. When 13% of Americans believe
they are currently infected with COVID-19 (mathematically impossible),
full-on panic is blocking our ability to think clearly and determine how
to deploy our resources to stop this virus.Over three-fourths of Americans are scared of what we are doing to our society through law and hysteria, not of infection or spreading COVID-19 to those most vulnerable.
The following article is a systematic overview of COVID-19 driven by
data from medical professionals and academic articles that will help you
understand what is going on (sources include CDC, WHO, NIH, NHS,
University of Oxford, Stanford, Harvard, NEJM, JAMA, and several
others). I’m quite experienced at understanding virality, how things
grow, and data. In my vocation, I’m most known for popularizing the
“growth hacking movement” in Silicon Valley that specializes in driving
rapid and viral adoption of technology products. Data is data. Our focus
here isn’t treatments but numbers. You don’t need a special degree to
understand what the data says and doesn’t say. Numbers are universal.
I hope you walk away with a more informed perspective on how you can
help and fight back against the hysteria that is driving our country
into a dark place. You can help us focus our scarce resources on those
who are most vulnerable, who need our help. Note: The following graphs and numbers are as of mid-March 2020.
Things are moving quickly, so I update this article twice a day. Most
graphs are as of March 20th, 2020.
* * *
Total cases are the wrong metric
A critical question to ask yourself when you first look at a data set is, “What is our metric for success?”.
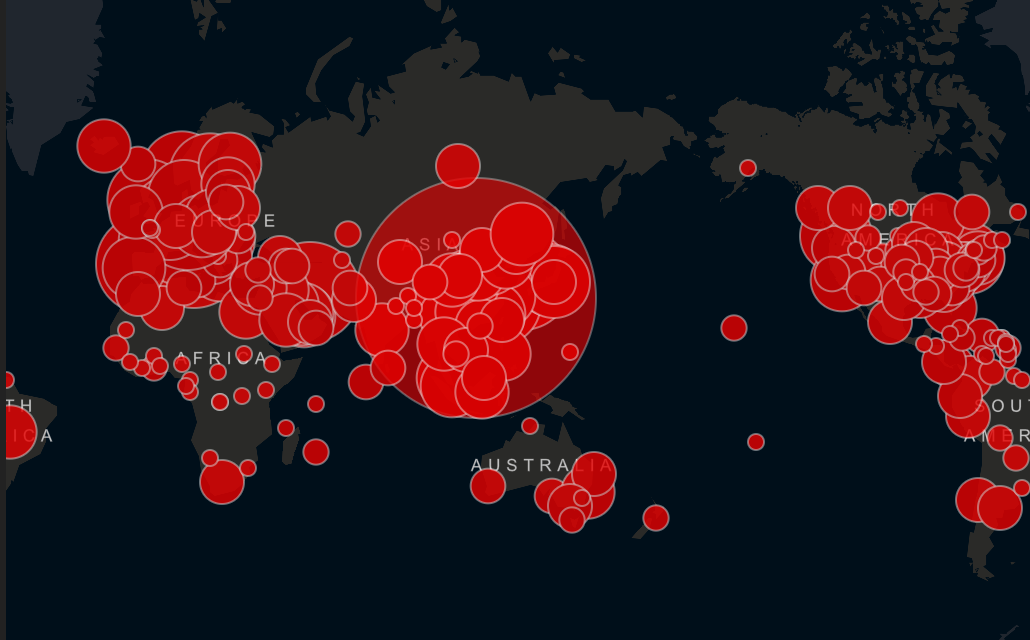
Let’s start at the top. How is it possible that more than 20% of Americans believe they will catch COVID-19? Here’s how. Vanity metrics — a single data point with no context. Wouldn’t this picture scare you? Look at all of those large red scary circles!
These images come from the now infamous John Hopkins COVID-19 tracking map. What started as a data transparency effort has now molded into an unintentional tool for hysteria and panic. An important question to ask yourself is what do these bubbles actually mean?
Each bubble represents the total number of COVID-19 cases per country.
The situation looks serious, yet we know that this virus is over four
months old, so how many of these cases are active? Immediately, we now see that just under half of those terrifying red bubbles aren’t relevant or actionable.
The total number of cases isn’t illustrative of what we should do now.
This is a single vanity data point with no context; it isn’t information
or knowledge. To know how to respond, we need more numbers to tell a
story and to paint the full picture. As a metaphor, the daily revenue of
a business doesn’t tell you a whole lot about profitability, capital
structure, or overhead. The same goes for the total number of cases. The
data isn’t actionable. We need to look at ratios and percentages to
tell us what to do next — conversion rate, growth rate, and severity.
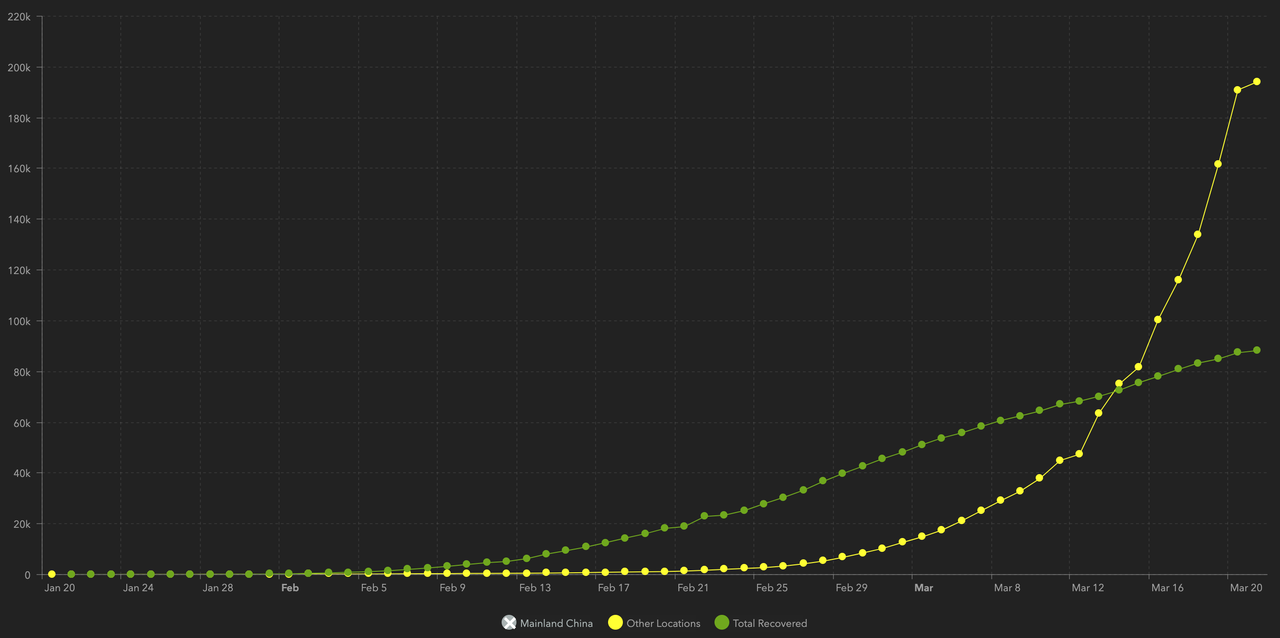
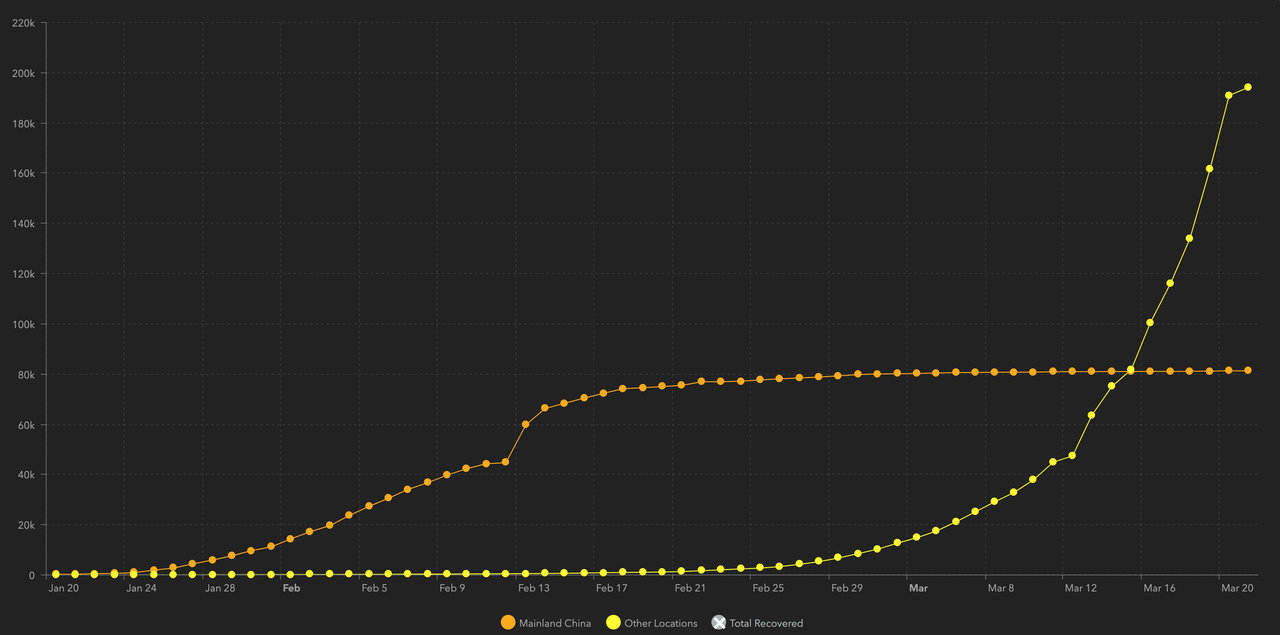
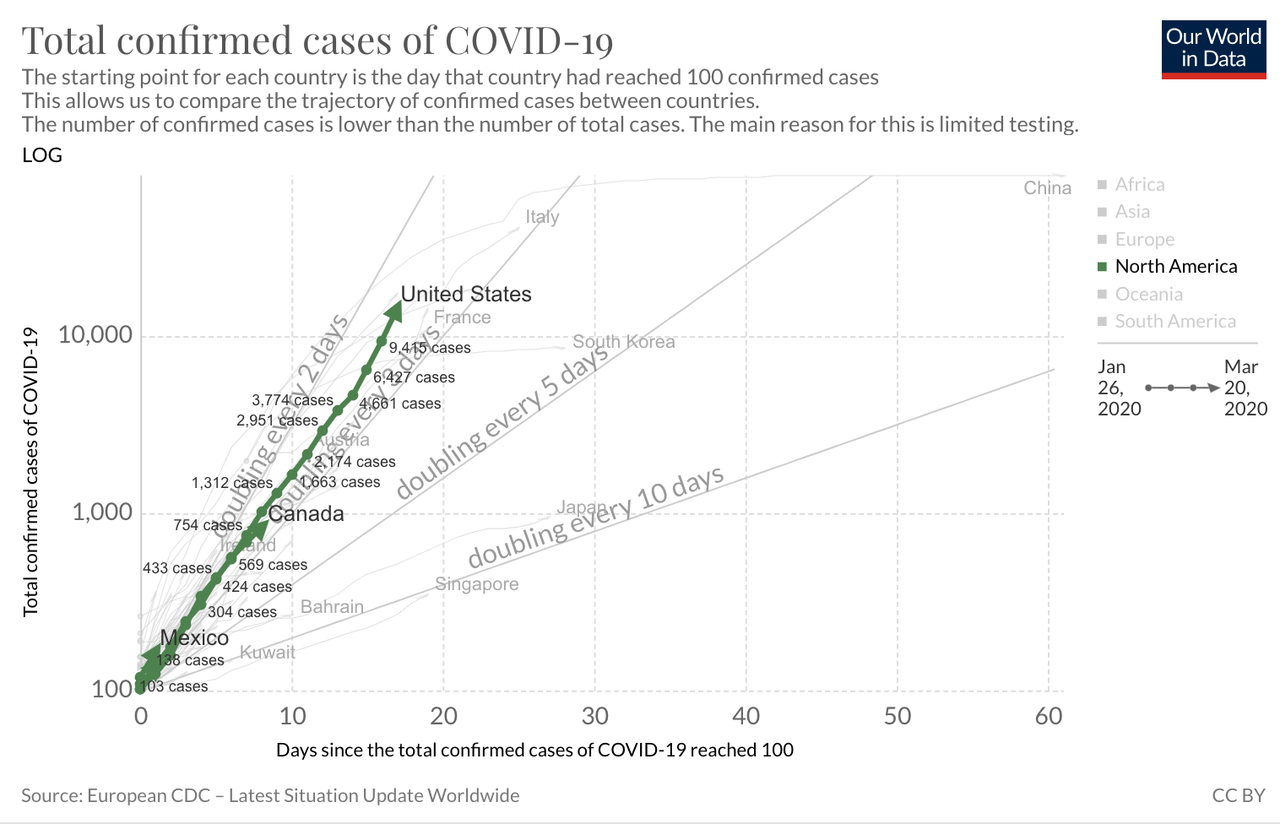
Time lapsing new cases gives us perspective
Breaking down each country by the date of the first infection helps
us track the growth and impact of the virus. We can see how total cases
are growing against a consistent time scale.
Here are new cases time lapsed by country and date of first 100 total cases.
Here is a better picture of US confirmed case daily growth. The United States is tracking with other European nations at doubling every three days or so.
As we measure and test more Americans, this will continue to grow. Our
time-lapse growth is lower than China, but not as good as South Korea,
Japan, Singapore, or Taiwan. All are considered models of how to beat
COVID-19. The United States is performing average, not great, compared
to the other modern countries by this metric.
Still, there is a massive blindspot with this type of graph. None of
these charts are weighted on a per-capita basis. It treats every country
as a single entity, as we will see this fails to tell us what is going
on in several aspects.
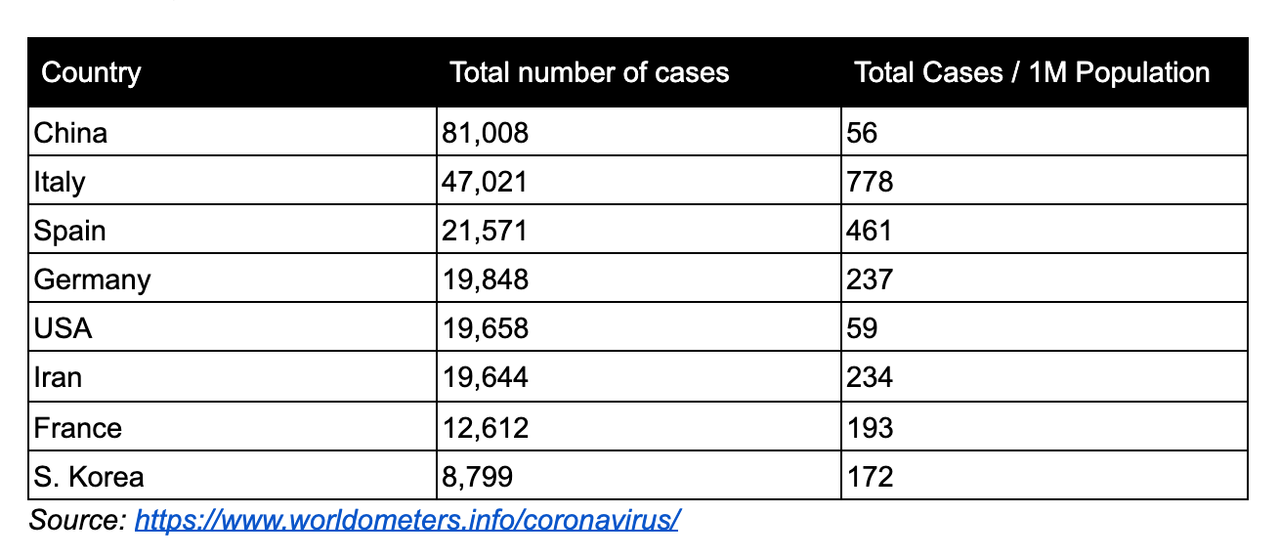
On a per-capita basis, we shouldn’t be panicking
Every country has a different population size which skews aggregate
and cumulative case comparisons. By controlling for population, you can
properly weigh the number of cases in the context of the local
population size. Viruses don’t acknowledge our human borders. The US
population is 5.5X greater than Italy, 6X larger than South Korea, and
25% the size of China. Comparing the US total number of cases in
absolute terms is rather silly.
Rank ordering based on the total number of cases shows that the US on
a per-capita basis is significantly lower than the top six nations by
case volume. On a 1 million citizen per-capita basis, the US moves to
above mid-pack of all countries and rising, with similar case volume as
Singapore (385 cases), Cyprus (75 cases), and United Kingdom(3,983
cases). This is data as of March 20th, 2020.
But total cases even on a per-capita basis will always be a losing
metric. The denominator (total population) is more or less fixed. We
aren’t having babies at the pace of viral growth. Per-capita won’t
explain how fast the virus is moving and if it is truly “exponential”.
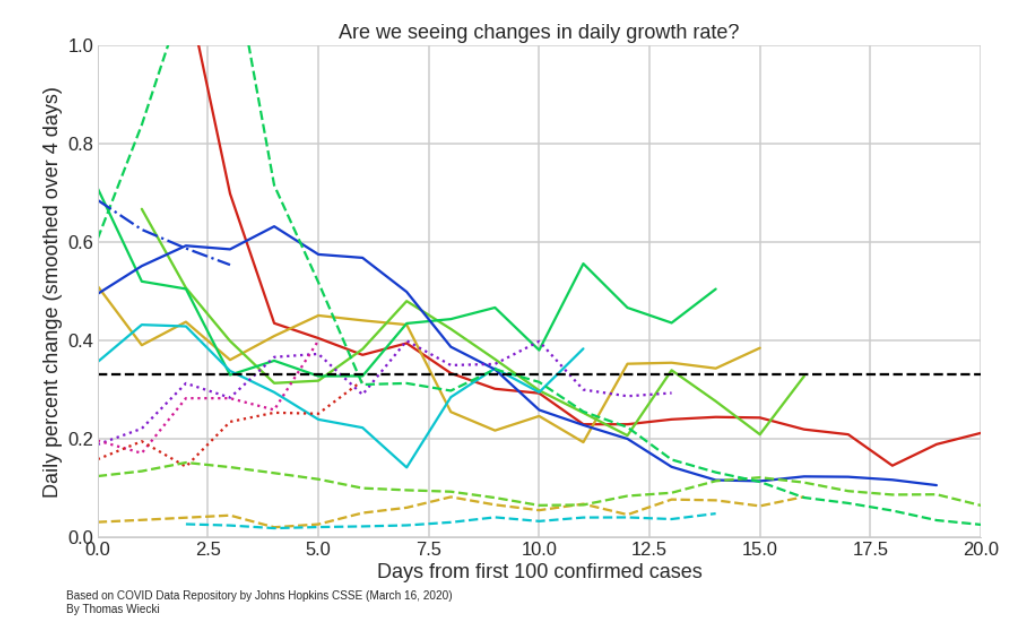
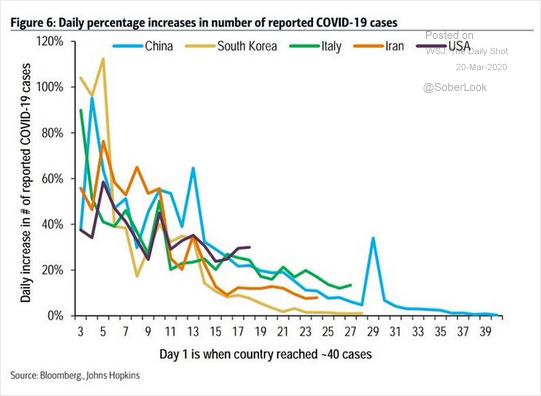
COVID-19 is spreading, but probably not accelerating
Growth rates are tricky to track over time. Smaller numbers are easy
to move than larger numbers. As an example, GDP growth of 3% for the US
means billions of dollars while 3% for Bermuda means millions.
Generally, growth rates decline over time, but the nominal increase may
still be significant. This holds true of daily confirmed case
increases. Daily growth rates declined over time across all
countries regardless of particular policy solutions, such as shutting
the borders or social distancing.
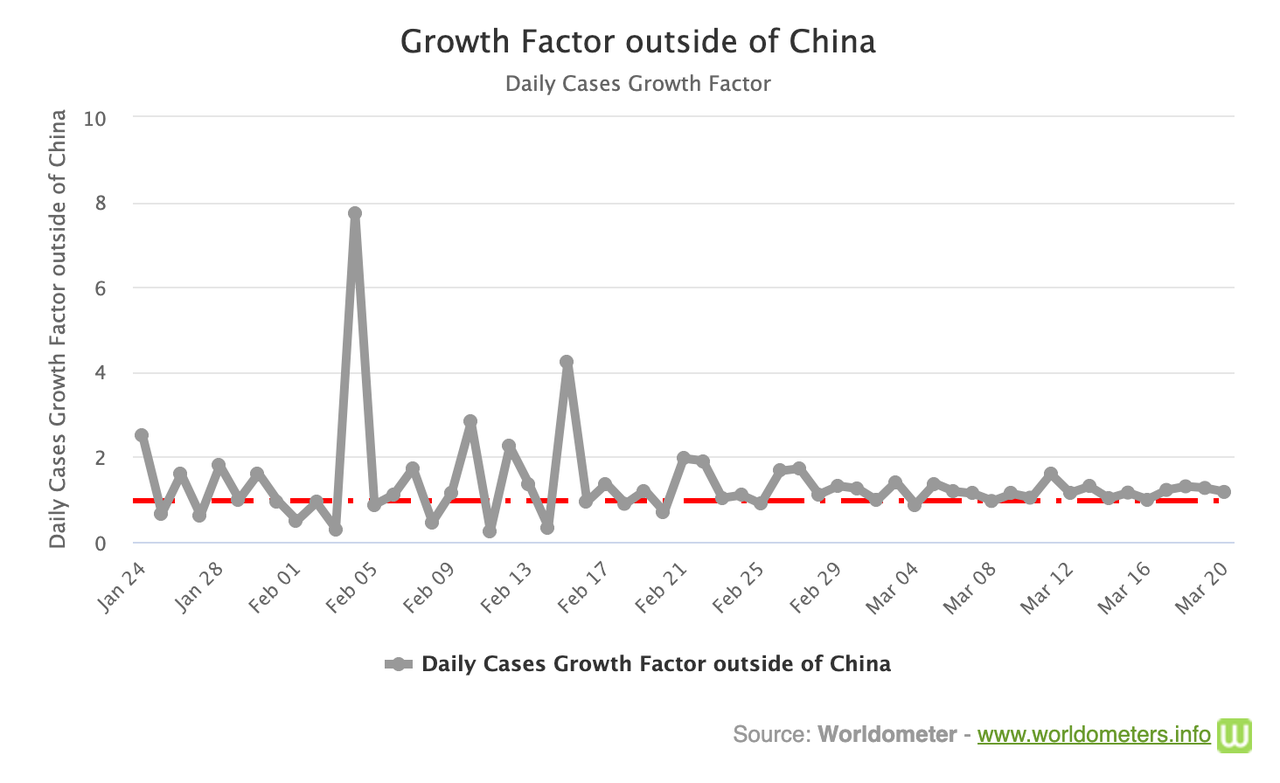
The daily growth data across the world is a little noisy.
Weighing daily growth of confirmed cases by a relative daily growth
factor cleans up the picture, more than 1 is increasing and below 1 is
declining. For all of March, the world has hovered around 1.1. This
translates to an average daily growth rate of 10%, with ups and downs on
a daily basis. This isn’t great, but it is good news as COVID-19 most
likely isn’t increasing in virality. The growth rate of the growth rate
is approximately 10%; however, the data is quite noisy. With
inconsistent country-to-country reporting and what qualifies as a
confirmed case, the more likely explanation is that we are increasing
our measurement, but the virus hasn’t increased in viral capability.
Recommended containment and prevention strategies are still quite
effective at stopping the spread. Cases globally are increasing (it is a virus after all!), but
beware of believing metrics designed to intentionally scare like “cases
doubling”. These are typically small numbers over small
numbers and sliced on a per-country basis. Globally, COVID-19’s growth
rate is rather steady. Remember, viruses ignore our national boundaries.
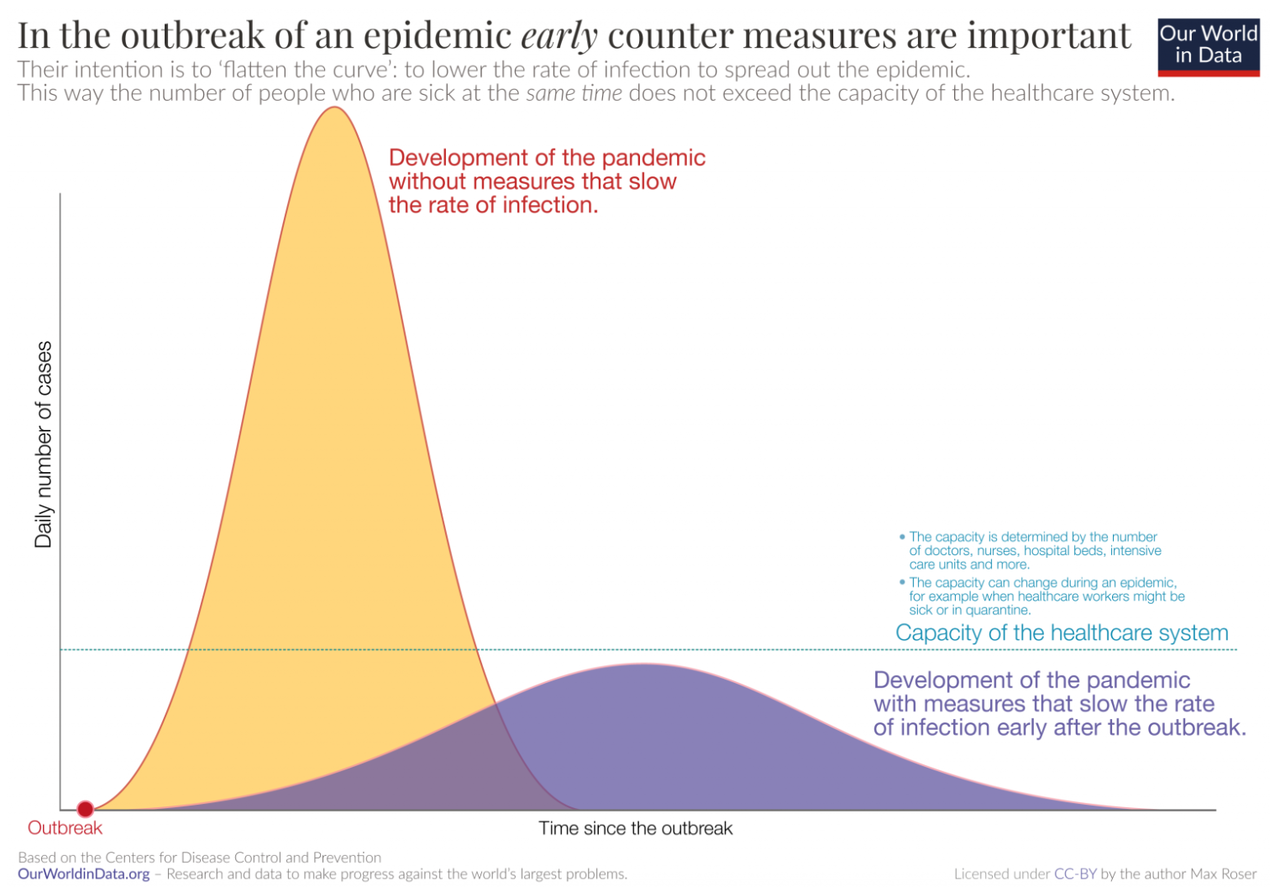
Viruses though don’t grow infinitely forever and forever. As with
most things in nature, viruses follow a common pattern — a bell curve.
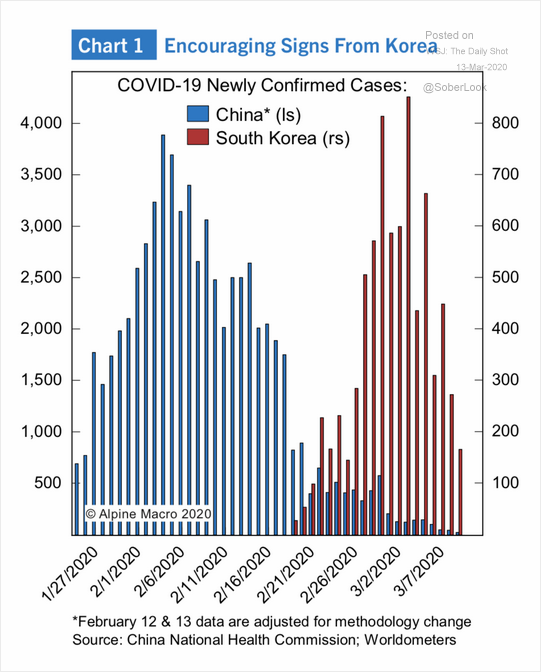
Watch the Bell Curve
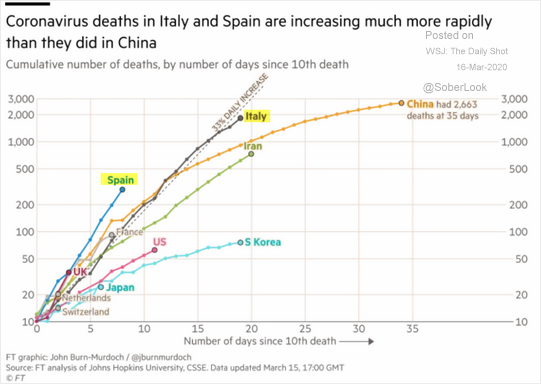
As COVID-19 spreads and declines (which it will decline despite what
the media tells you), every country will follow a similar pattern. The
following is a more detailed graph of S. Korea’s successful defeat of
COVID-19 compared also to China with thousands of more cases and deaths.
It is a bell curve:
Here is a more detailed graph of S. Korea graphed against the total number of cases.
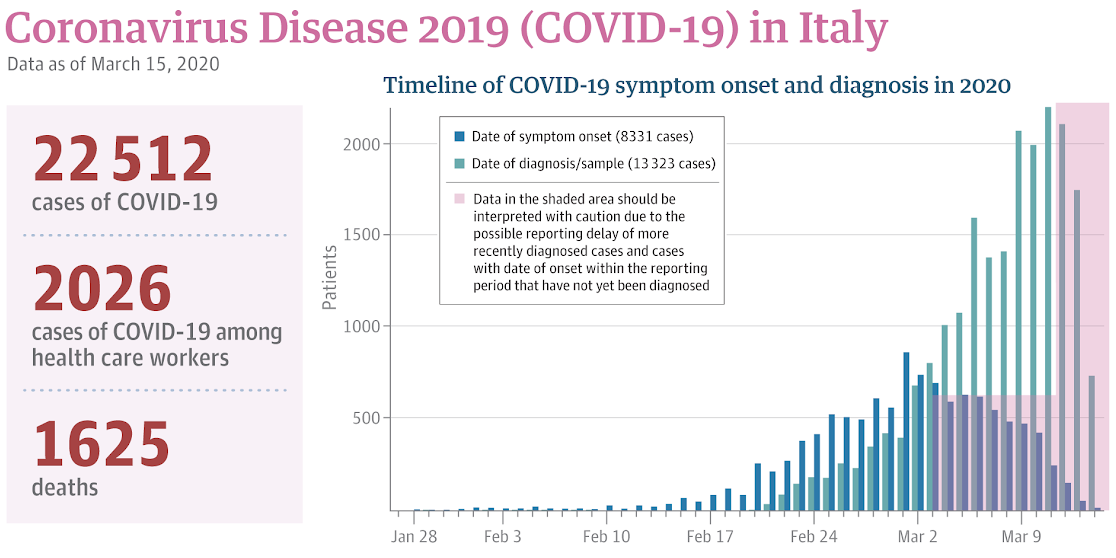
Here is a graph from Italy showing a bell curve in symptom onset and
number of cases, which may point to the beginning of the end for Italy — JAMA — https://jamanetwork.com/journals/jama/pages/coronavirus-alert
Bell curves is the dominant trait of outbreaks. A virus doesn’t grow
linearly forever. It accelerates, plateaus, and then declines. Whether
it is environmental or our own efforts, viruses accelerate and quickly
decline. This fact of nature is represented in Farr’s law. CDC’s of “bend the curve” or “flatten the curve” reflects this natural reality.
It is important to note that in both scenarios, the total number of
COVID-19 cases will be similar. “Flattening the curve”’s focus is a
shock to the healthcare system which can increase fatalities due to
capacity constraints. In the long-term, it isn’t infection prevention.
Unfortunately, “flattening the curve” doesn’t include other downsides
and costs of execution.
Both the CDC and WHO are optimizing virality and healthcare
utilization, while ignoring the economic shock to our system. Both
organizations assume you are going to get infected, eventually, and it
won’t be that bad.
A low probability of catching COVID-19
The World Health Organization (“WHO”) released a study on
how China responded to COVID-19. Currently, this study is one of the
most exhaustive pieces published on how the virus spreads.
The results of their research show that COVID-19 doesn’t spread as easily as we first thought or the media had us believe (remember people abandoned their dogs out of fear of getting infected). According
to their report if you come in contact with someone who tests positive
for COVID-19 you have a 1–5% chance of catching it as well. The variability is large because the infection is based on the type of contact and how long.
The majority of viral infections come from prolonged exposures in
confined spaces with other infected individuals. Person-to-person and
surface contact is by far the most common cause. From the WHO report,
“When a cluster of several infected people occurred in China, it was
most often (78–85%) caused by an infection within the family by droplets
and other carriers of infection in close contact with an infected
person.
From the CDC’s study on transmission in China and Princess Cruise outbreak -
A growing body of evidence indicates that COVID-19 transmission
is facilitated in confined settings; for example, a large cluster (634
confirmed cases) of COVID-19 secondary infections occurred aboard a
cruise ship in Japan, representing about one fifth of the persons aboard
who were tested for the virus. This finding indicates the high
transmissibility of COVID-19 in enclosed spaces
Dr. Paul Auwaerter, the Clinical Director for the Division of
Infectious Diseases at Johns Hopkins University School of Medicine
echoes this finding,
“If you have a COVID-19 patient in your household, your risk of
developing the infection is about 10%….If you were casually exposed to
the virus in the workplace (e.g., you were not locked up in conference
room for six hours with someone who was infected [like a hospital]), your chance of infection is about 0.5%”
According to Dr. Auwaerter, these transmission rates are very similar to the seasonal flu.
Air-based transmission or untraceable community spread is very
unlikely. According to WHO’s COVID-19 lead Maria Van Kerkhove, true
community based spreading is very rare. The data from China shows that
community-based spread was only a very small handful of cases. “This
virus is not circulating in the community, even in the highest incidence
areas across China,” Van Kerkhove said.
“Transmission by fine aerosols in the air over long distances is not one of the main causes of spread. Most
of the 2,055 infected hospital workers were either infected at home or
in the early phase of the outbreak in Wuhan when hospital safeguards
were not raised yet,” she said.
True community spread involves transmission where people get infected
in public spaces and there is no way to trace back the source of
infection. WHO believes that is not what the Chinese data shows. If
community spread was super common, it wouldn’t be possible to reduce the
new cases through “social distancing”.
“We have never seen before a respiratory pathogen that’s capable of
community transmission but at the same time which can also be contained
with the right measures. If this was an influenza epidemic, we would
have expected to see widespread community transmission across the globe
by now and efforts to slow it down or contain it would not be feasible,”
said Tedros Adhanom, Director-General of WHO.
An author of a working paper from
the Department of Ecology and Evolutionary Biology at Princeton
University said, “The current scientific consensus is that most
transmission via respiratory secretions happens in the form of large
respiratory droplets … rather than small aerosols. Droplets,
fortunately, are heavy enough that they don’t travel very far and
instead fall from the air after traveling only a few feet.”
The media was put into a frenzy when
the above authors released their study on COVID-19’s ability to survive
in the air. The study did find the virus could survive in the air for a
couple of hours; however, this study was designed as academic exercise
rather than a real-world test. This study put COVID-19 into a spray
bottle to “mist” it into the air. I don’t know anyone who coughs in mist
form and it is unclear if the viral load was large enough to infect
another individual As one doctor, who wants to remain anonymous, told
me, “Corona doesn’t have wings”.
To summarize, China, Singapore, and South Korea’s containment efforts
worked because community-based and airborne transmission aren’t common.
The most common form of transmission is person-to-person or
surface-based.
Common transmission surfaces
COVID-19’s ability to live for a long period of time is limited on most surfaces and it is quite easy to kill with typical household cleaners, just like the normal flu.
COVID-19 be detected on copper after 4 hours and 24 hours on cardboard.
COVID-19 survived best on plastic and stainless steel, remaining viable for up to 72 hours
COVID-19 is very vulnerable to UV light and heat.
Presence doesn’t mean infectious. The viral concentration falls
significantly over time. The virus showed a half-life of about 0.8 hours
on copper, 3.46 hours on cardboard, 5.6 hours on steel and 6.8 hours on
plastic. According to Dylan Morris, one
of the authors, “We do not know how much virus is actually needed to
infect a human being with high probability, nor how easily the virus is
transferred from the cardboard to one’s hand when touching a package”
According to Dr. Auwaerter, “It’s thought that this virus can survive
on surfaces such as hands, hard surfaces, and fabrics. Preliminary data
indicates up to 72 hours on hard surfaces like steel and plastic, and
up to 12 hours on fabric.”
COVID-19 will likely “burn off” in the summer
Due to COVID-19’s sensitivity to UV light and heat (just like the
normal influenza virus), it is very likely that it will “burn off” as
humidity increases and temperatures rise.
Released on March 10th, one study mapped
COVID-19 virality capability by high temperature and high humidity. It
found that both significantly reduced the ability of the virus to spread
from person-to-person. From the study,
“This result is consistent with the fact that the high temperature
and high humidity significantly reduce the transmission of influenza. It
indicates that the arrival of summer and rainy season in the northern
hemisphere can effectively reduce the transmission of the COVID-19.”
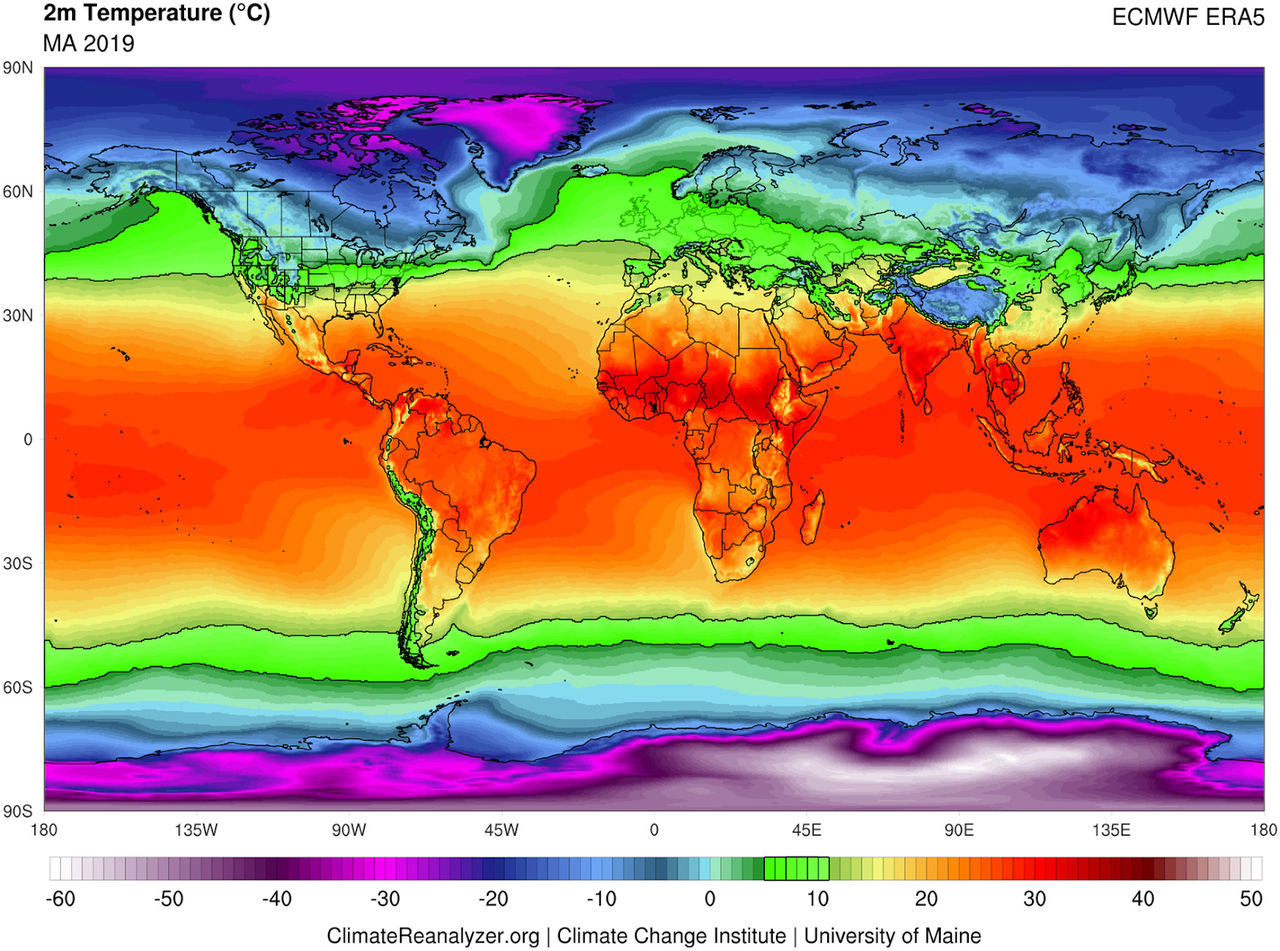
The University of Maryland mapped
severe COVID-19 outbreaks with local weather patterns around the world,
from the US to China. They found that the virus thrives in a certain
temperature and humidity channel. “The researchers found that all cities
experiencing significant outbreaks of COVID-19 have very similar winter
climates with an average temperature of 41 to 52 degrees Fahrenheit, an
average humidity level of 47% to 79% with a narrow east-west
distribution along the same 30–50 N” latitude”, said the University of
Maryland.
“Based on what we have documented so far, it appears that the virus
has a harder time spreading between people in warmer, tropical
climates,” said study leader Mohammad Sajadi, MD, Associate Professor of
Medicine in the UMSOM, physician-scientist at the Institute of Human
Virology and a member of GVN.
In the image below, the zone at risk for a significant community
spread in the near-term includes land areas within the green bands.
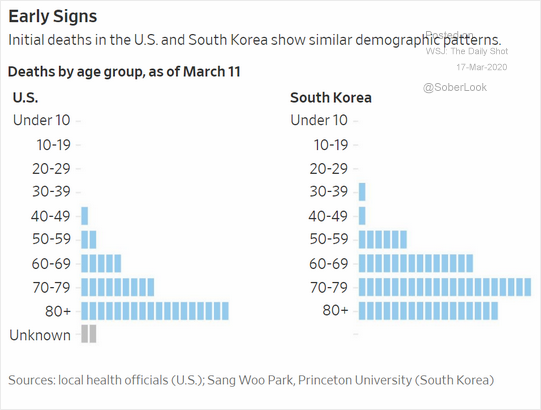
Children and Teens aren’t at risk
It’s already well established that the young aren’t particularly vulnerable.
In fact, there isn’t a single death reported below the age of 10 in the
world and most children who test positive don’t show symptoms. As
well, infection rates are lower for individuals below the age of 19, which is similar to SARS and MERS (COVID-19’s sister viruses).
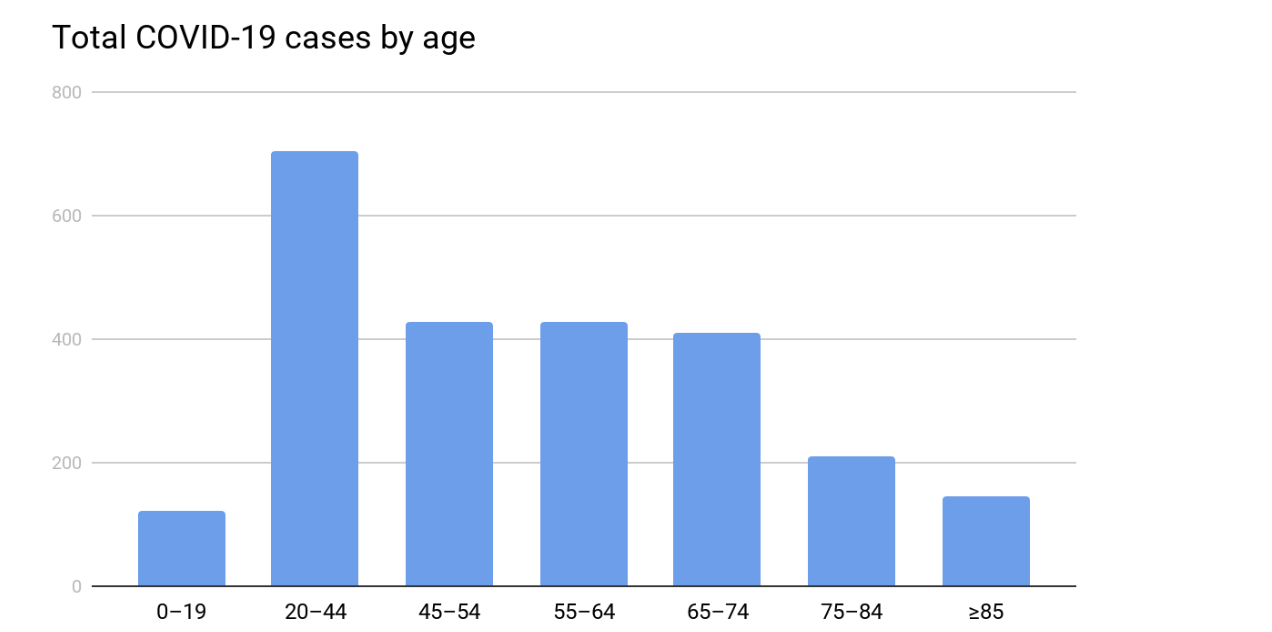
According to the WHO’s COVID-19 mission in China, only 8.1% of cases
were 20-somethings, 1.2% were teens, and 0.9% were 9 or younger. As of
the study date February 20th, 78% of the cases reported were ages 30 to
69. The WHO hypothesizes this is for a biological reason and isn’t
related to lifestyle or exposure.
“Even when we looked at households, we did not find a single
example of a child bringing the infection into the household and
transmitting to the parents. It was the other way around. And the children tend to have a mild disease,” said Van Kerkhove.
According to a WSJ article, children have a near-zero chance of becoming ill. They are more likely to get normal flu than COVID-19.
A World Health Organization report on China concluded that cases of
Covid-19 in children were “relatively rare and mild.” Among cases in
people under age 19, only 2.5% developed severe disease while 0.2%
developed critical disease. Among nearly 6,300 Covid-19 cases reported
by the Korea Centers for Disease Control & Prevention on March 8,
there were no reported deaths in anyone under 30. Only 0.7% of
infections were in children under 9 and 4.6% of cases were in those ages
10 to 19 years old
Only 2% of the patients in a review of nearly 45,000 confirmed
Covid-19 cases in China were children, and there were no reported deaths
in children under 10, according to a study published in JAMA last
month. (In contrast, there have been 136 pediatric deaths from influenza
in the U.S. this flu season.)
About 8% of cases were in people in their 20s. Those 10 to 19 years
old accounted for 1% of cases and those under 10 also accounted for only
1%.
However even if children and teens are not suffering severe
symptoms themselves, they may “shed” large amounts of virus and may do
so for many days, says James Campbell, a professor of pediatrics at the University of Maryland School of Medicine.
Children had a virus in their secretions for six to 22 days or an
average of 12 days. “Shedding virus doesn’t always mean you’re able to
transmit the virus”, he notes. It is still important to consider that
prolonged shedding of high viral loads from children is still a risky
combination within the home since the majority of transmission occurs
within a home-like confined environment.
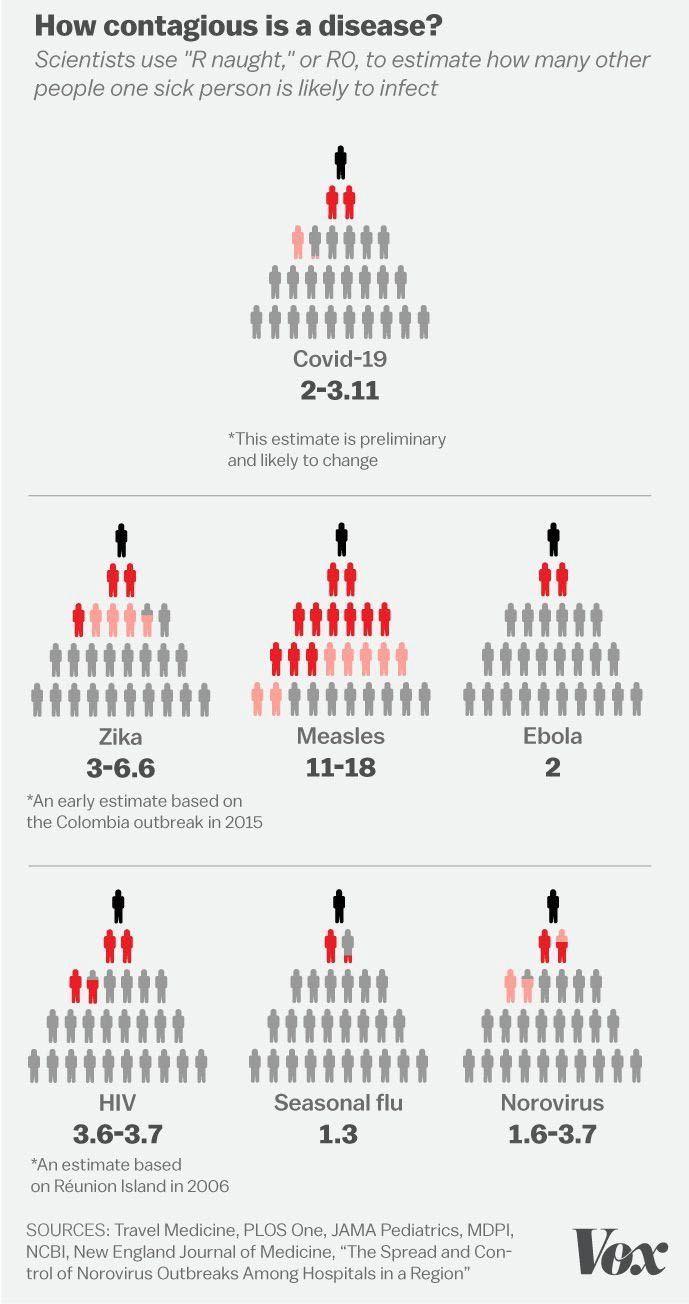
A strong, but unknown viral effect
While the true viral capacity is unknown at this moment, it is
theorized that COVID-19 is more than the seasonal flu but less than
other viruses. The average number of people to which a single infected
person will transmit the virus, or Ro, range from as low as 1.5 to a high of 3.0
Newer analysis suggests that this viral rate is declining. According to Nobel Laureate and biophysicist Michael Levitt, the infection rate is declining -
“Every coronavirus patient in China infected on average 2.2
people a day — spelling exponential growth that can only lead to
disaster. But then it started dropping, and the number of new daily
infections is now close to zero.” He compared it to interest rates
again: “even if the interest rate keeps dropping, you still make money.
The sum you invested does not lessen, it just grows more slowly. When
discussing diseases, it frightens people a lot because they keep hearing
about new cases every day. But the fact that the infection rate is
slowing down means the end of the pandemic is near.”
What about asymptomatic spread?
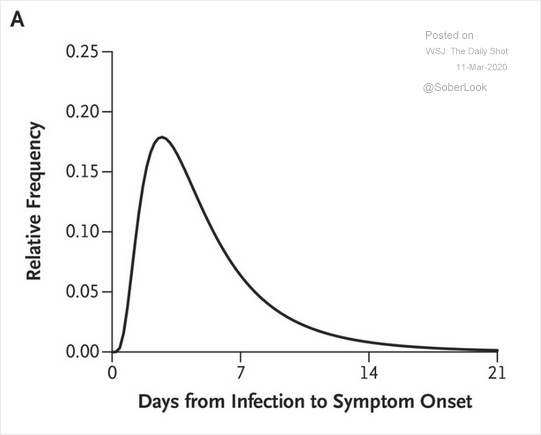
The majority of cases see symptoms within a few days, not two weeks as originally believed.
On true asymptomatic spread, the data is still unclear but
increasingly unlikely. Two studies point to a low infection rate from
pre-symptomatic and asymptomatic individuals. One study said 10% of infections come from people who don’t show symptoms, yet. Another WHO study reported 1.2% of confirmed cases were truly asymptomatic. Several studies confirming
asymptotic spread have ended up disproven. It is important to note
there is a difference between “never showing symptoms” and
“pre-symptomatic” and the media is promoting an unproven narrative.
Almost all people end up in the latter camp within five days, almost
never the former. It is very unlikely for individuals with COVID-19 to
never show symptoms. WHO and CDC claim that asymptomatic spread isn’t a concern and quite rare.
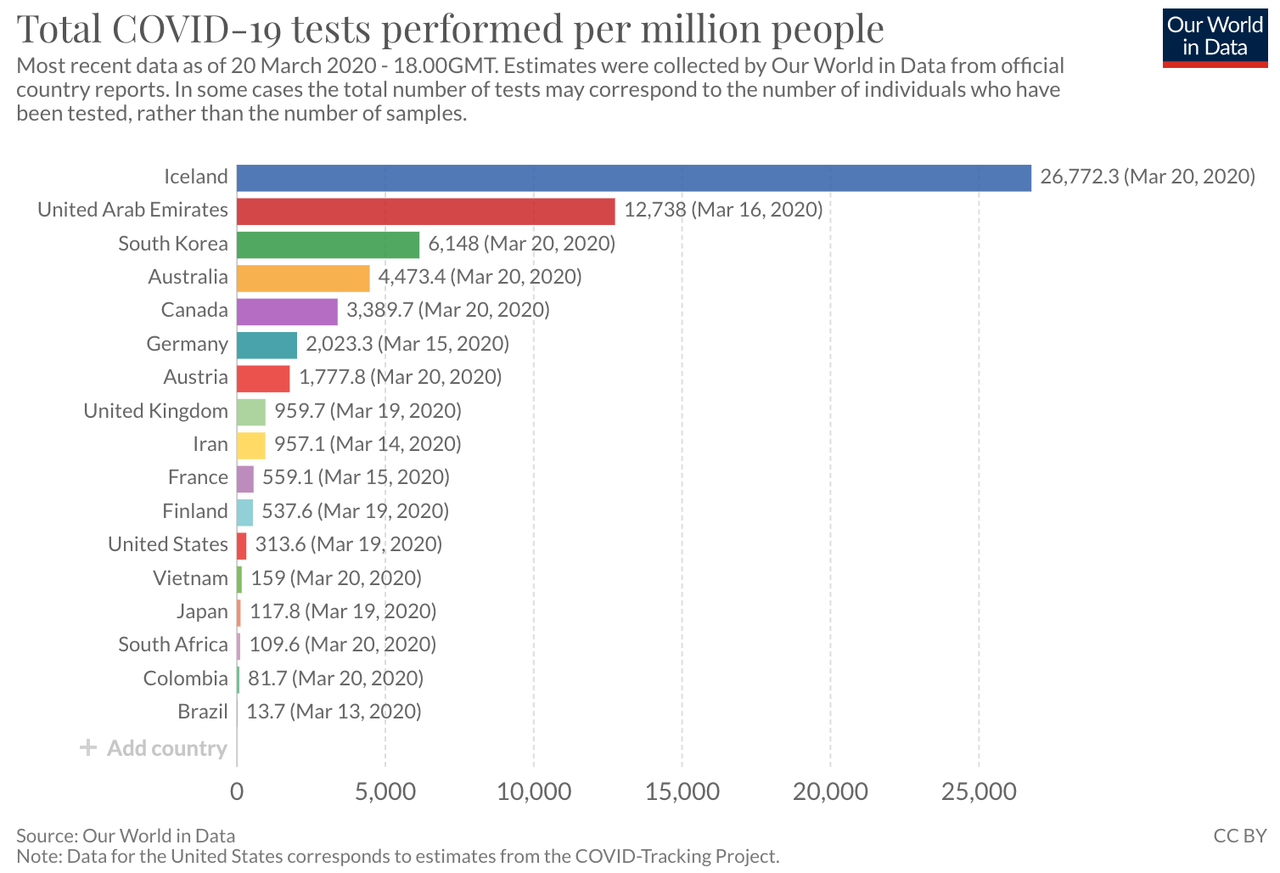
Iceland is leading the global in testing its entire population of
~300,000 for asymptomatic spread, not just those that show symptoms. They randomly tested 1,800 citizens who
don’t show symptoms and, as far as they knew, were not exposed to
positive individuals. Of this sample, only 19 tested positive for
COVID-19, or 1.1% of the sample.
Obviously, this type of viral spread is the most concerning; however
based on the level of media attention and the global size of positive
infections, it seems more probable we keep looking for a COVID-19 viral
trait that doesn’t exist.
Another way of looking at virality and asymptotic spread is the
number of flight attendants, airport staff, or pilots that have tested
positive for COVID-19. Out of the thousands of flights since November
2019, only a handful of airport and airline staff have tested positive
(such as AA pilot, some BA staff, and several TSA employees).
Outside of medical and hospital staff, these individuals are in
greatest contact with infected persons in confined spaces. Despite
having no protective gear and most likely these people were
asymptomatic, airline and airport staff aren’t likely to catch COVID-19
compared to the rest of the population. Those employed in the travel
sector are infected at a lower rate than the general population or
healthcare workers.
“We still believe, looking at the data, that the force of infection
here, the major driver, is people who are symptomatic, unwell, and
transmitting to others along the human-to-human route,” Dr. Mike Ryan of
WHO Emergencies Program.
If the symptoms are so close to other less fatal coronaviruses, what is the positivity rate of those tested?
93% of people who think they are positive aren’t
Looking at the success in S. Korea and Singapore, the important tool
in our war chest is measurement. If we are concerned about the general
non-infected population, what is the probability those who show symptoms
actually test positive? What is the chance that the cough from your
neighbor is COVID-19? This “conversion rate” will show whether or not
you have a cold (another coronavirus) or heading to isolation for two
weeks. Global data shows that ~95% of people who are tested aren’t
positive. The positivity rate varies by country.
UK: 7,132 concluded tests, of which 13 positive (0.2% positivity rate).
UK: 48,492 tests, of which 1,950 (4.0% positivity rate)
Italy: 9,462 tests, of which 470 positive (at least 5.0% positivity rate).
Italy: 3,300 tests, of which 99 positive (3.0% positivity rate)
Iceland: 3,787 tests, of which 218 positive (5.7% positive rate)
France: 762 tests, of which 17 positive, 179 awaiting results (at least 2.2% positivity rate).
Austria: 321 tests, of which 2 positive, awaiting results: unknown (at least 0.6% positivity rate).
South Korea: 66,652 tests with 1766 positives 25,568 awaiting results (4.3% positivity rate).
United States: 445 concluded tests, of which 14 positive (3.1% positivity rate).
In the US, drive-thru testing facilities are being deployed around the nation. Gov. Cuomo of NY released initial data from
their drive-thru testing. Out of the 600~ that was tested in a single
day, ~7% were positive. Tested individuals actively show symptoms and
present a doctor’s note. This result is similar to public tracking on US
nationwide positivity rate. University of Oxford’s Our World in Data attempts
to track public reporting on individuals tested vs positive cases of
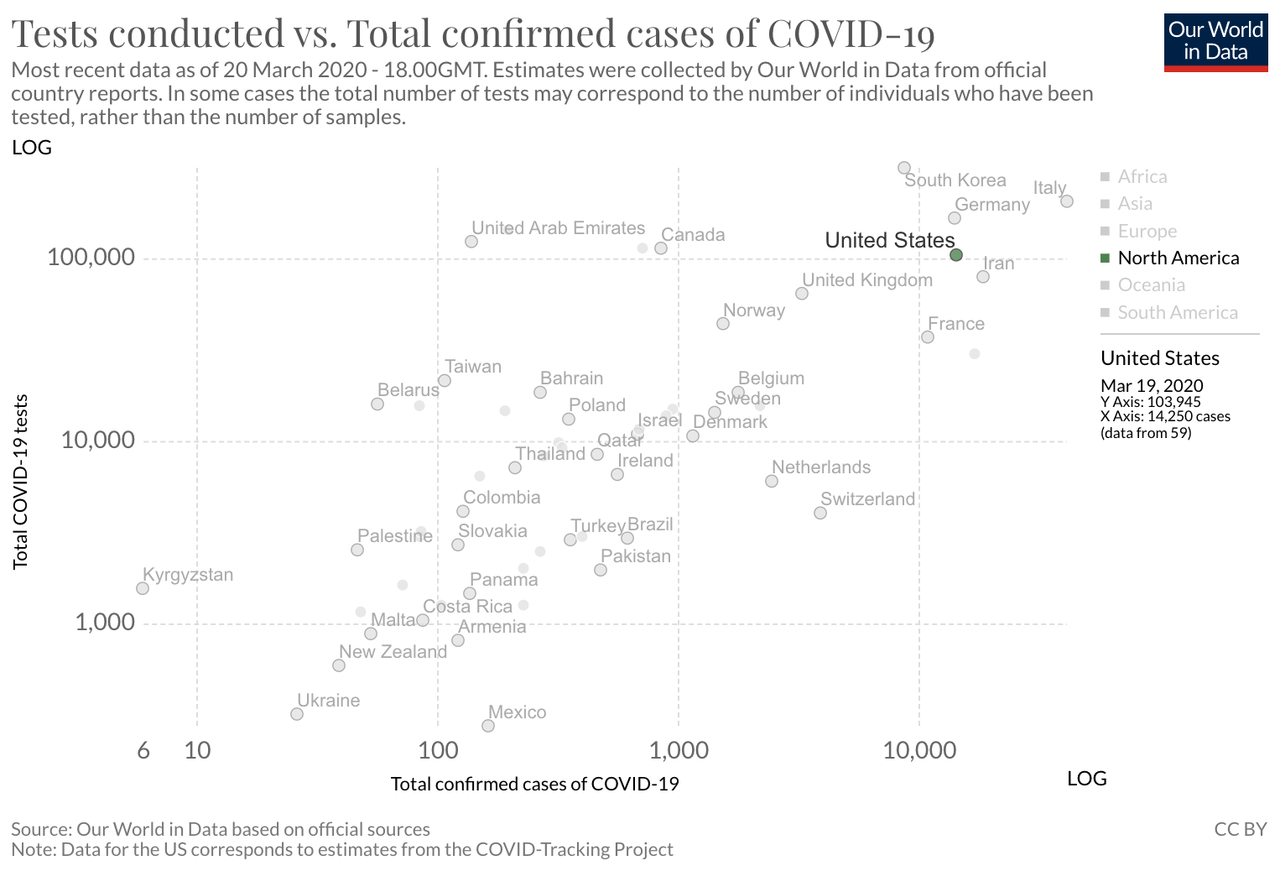
COVID-19. For the US, it estimates 14.25% of those tested are positive.
Last week, the US was significantly behind in testing, near the
bottom of all countries worldwide. As of March 20th, a week later, the
US is much closer to other G8 and European countries, but there is a
long way to go.
Based on the initial results and the results from other countries,
the total number of positive COVID-19 cases will increase as testing
increases, but the fatality rate will continue to fall and the severity
case mix will fall.
In general, the size of the US population infected with COVID-19 will
be much smaller than originally estimated as most symptomatic
individuals aren’t positive. 93% — 99% have other conditions.
Globally, the US has a long way to go to catch up in testing. As
testing expands, the total number of cases will increase, but the mild
to severe case ratio will decline dramatically.
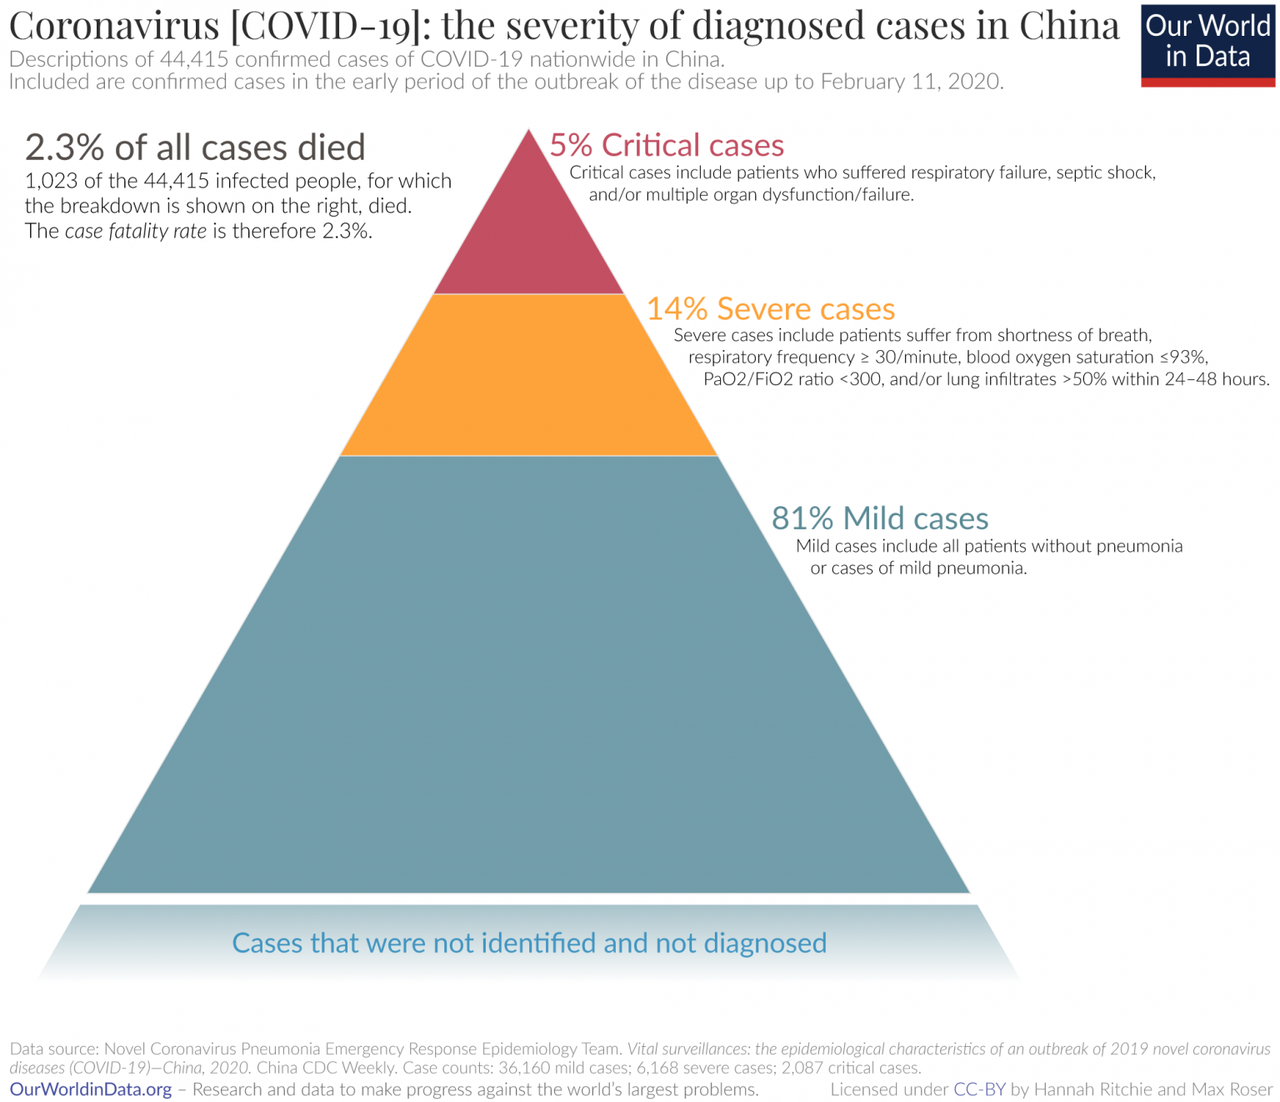
1% of cases will be severe
Looking at the whole funnel from top to bottom, ~1% of everyone who is tested for COVID-19 with the US will have a severe case that will require a hospital visit or long-term admission.
Globally, 80–85% of all cases are mild. These will not require a
hospital visit and home-based treatment/ no treatment is effective.
As of mid-March, the US has a significantly lower case severity rate
than other countries. Our current severe caseload is similar to South
Korea. This data has been spotty in the past; however, lower severity is
reflected in the US COVID-19 fatality rates (addressed later).
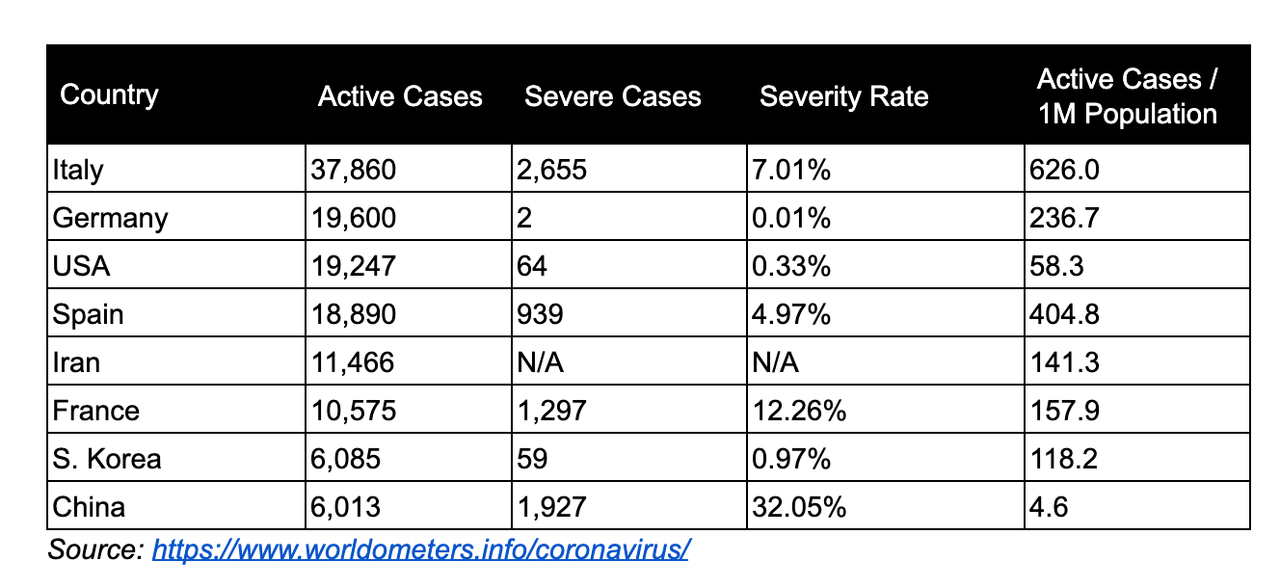
For context, this year’s flu season has
led to at least 17 million medical visits and 370,000 hospitalizations
(0.1%) out of 30–50 million infections. Recalling that only comparing
aggregate total cases isn’t helpful, breaking down active cases on a
per-capita basis paints a different picture on severity. This is data as
of March 20th, 2020.
Declining fatality rate
As the US continues to expand testing, the case fatality rate will
decline over the next few weeks. There is little doubt that serious and
fatal cases of COVID-19 are being properly recorded. What is unclear is
the total size of mild cases. WHO
originally estimated a case fatality rate of 4% at the beginning of the
outbreak but revised estimates downward 2.3% — 3% for all age groups. CDC estimates 0.5% — 3%, however stresses that closer to 1% is more probable. Dr. Paul Auwaerter estimated 0.5% — 2%, leaning towards the lower end. A paper released on March 19th analyzed
a wider data set from China and lowered the fatality rate to 1.4%. This
won’t be clear for the US until we see the broader population that is
positive but with mild cases. With little doubt, the fatality rate and
severity rate will decline as more people are tested and more mild cases
are counted.
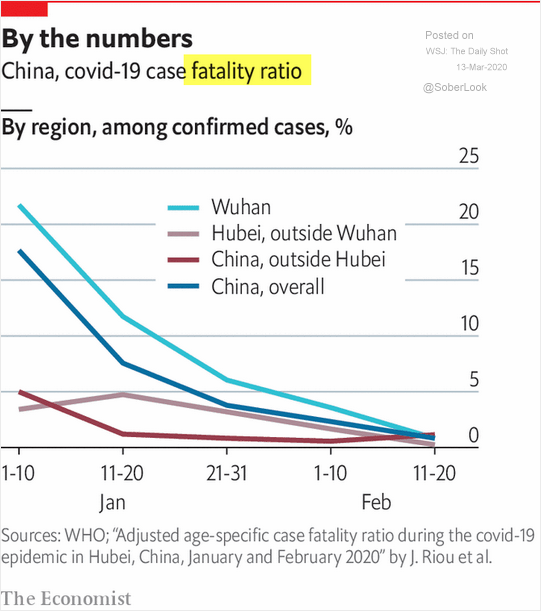
Higher fatality rates in China, Iran, and Italy are more likely associated with a sudden shock to the healthcare system unable
to address demands and doesn’t accurately reflect viral fatality rates.
As COVID-19 spread throughout China, the fatality rate drastically fell
outside of Hubei. This was attributed to the outbreak slowing spreading
to several provinces with low infection rates.
John P.A. Ioannidis is professor of medicine, of epidemiology and
population health, of biomedical data science, and of statistics at
Stanford University and co-director of Stanford’s Meta-Research
Innovation Center recently wrote about fatality rates and how our current instrumentation is leading to faulty policy solutions:
“The one situation where an entire, closed population was tested
was the Diamond Princess cruise ship and its quarantine passengers. The
case fatality rate there was 1.0%, but this was a largely elderly
population, in which the death rate from Covid-19 is much higher. Projecting the Diamond Princess mortality rate onto the age
structure of the U.S. population, the death rate among people infected
with Covid-19 would be 0.125%. But since this estimate is based on
extremely thin data — there were just seven deaths among the 700
infected passengers and crew — the real death rate could stretch from
five times lower (0.025%) to five times higher (0.625%). It is also
possible that some of the passengers who were infected might die later,
and that tourists may have different frequencies of chronic diseases — a
risk factor for worse outcomes with SARS-CoV-2 infection — than the
general population. Adding these extra sources of uncertainty…” “Reasonable estimates for the case fatality ratio in the general U.S. population vary from 0.05% to 1%.”
Looking at the US fatality, the fatality rate is drastically
declining as the number of cases increases, halving every four or five
days. The fatality rate will eventually level off and plateau as the US
case-mix becomes apparent.
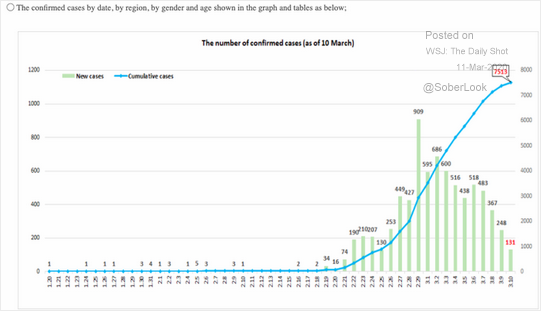
4.06% March 8 (22 deaths of 541 cases)
3.69% March 9 (26 of 704)
3.01% March 10 (30 of 994)
2.95% March 11 (38 of 1,295)
2.52% March 12 (42 of 1,695)
2.27% March 13 (49 of 2,247)
1.93% March 14 (57 of 2,954)
1.84% March 15 (68 of 3,680)
1.90% March 16 (86 of 4,503)
1.76% March 17 (109 of 6,196)
1.66% March 18 (150 of 9,003)
1.51% March 19th (208 of 13,789)
1.32% March 20th (256 of 19,383)
Source: Worldometers.info
Mapped against other countries, our fatality rate and case-mix are
following a similar pattern to South Korea which is a good sign, a
supposed model of how to manage COVID-19.
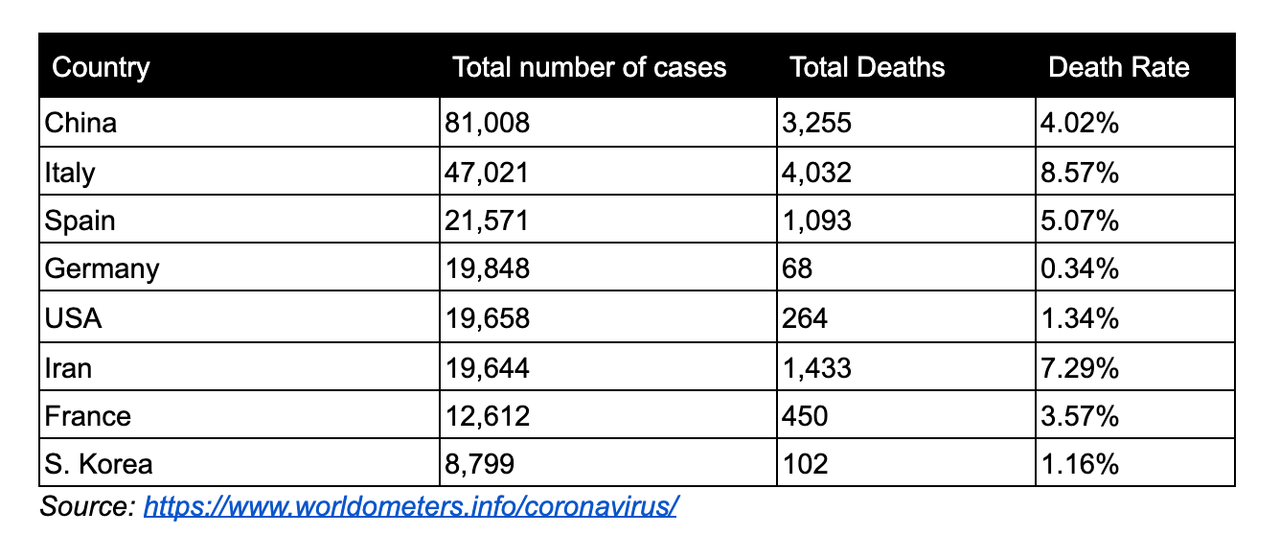
Here are deaths weighted by the total number of cases as of March
20th, 2020. Ranked by the total number of cases, our death rate is
closer to South Korea’s than Spain’s or Italy’s.
The initial higher fatality rate for the US is trending much lower than originally estimated.
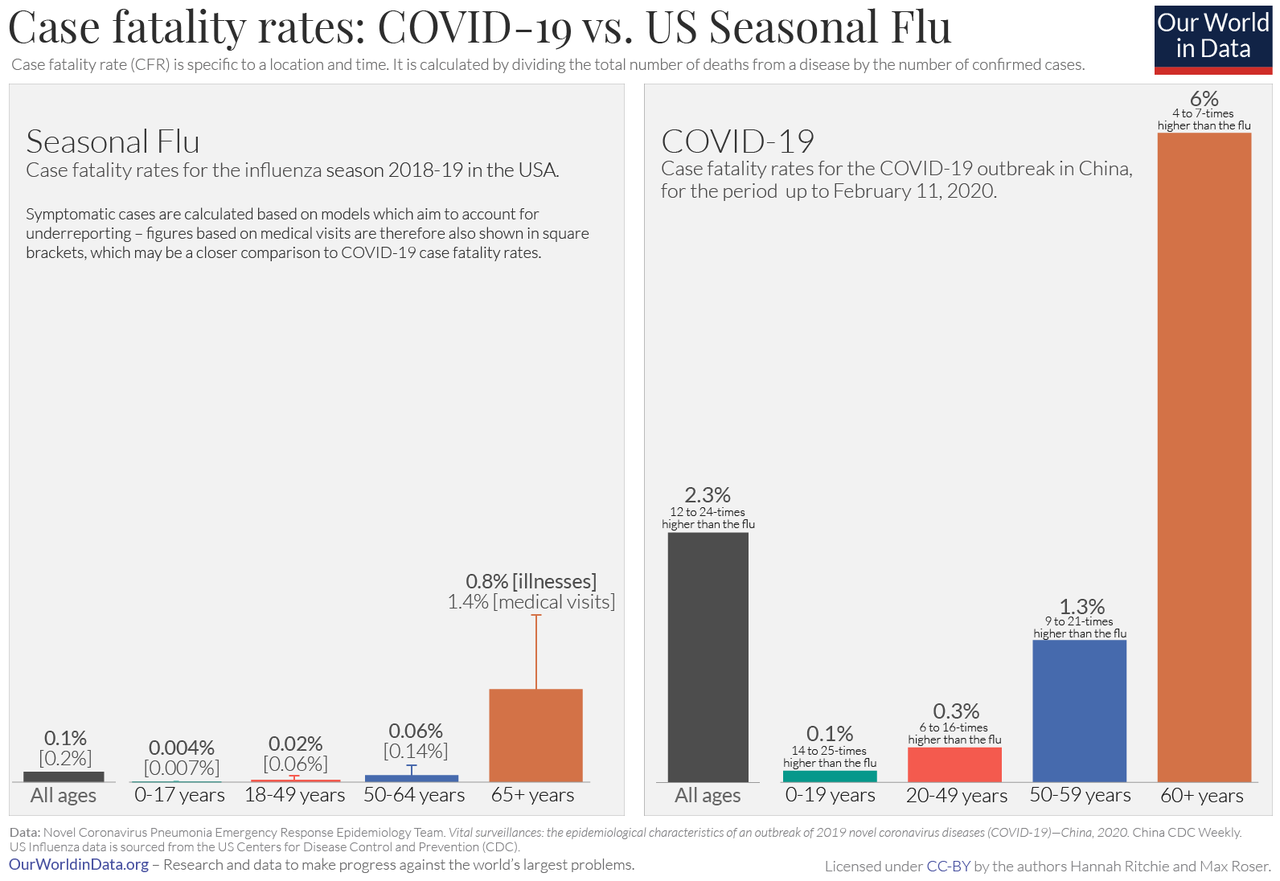
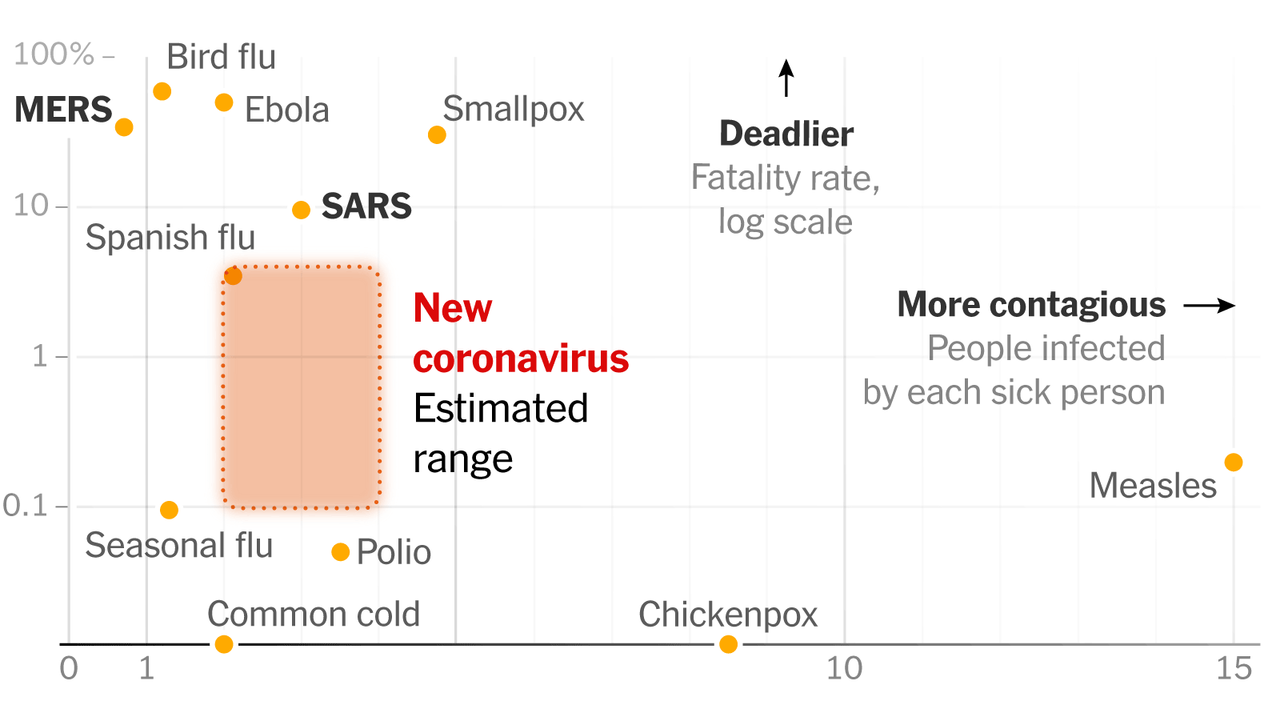
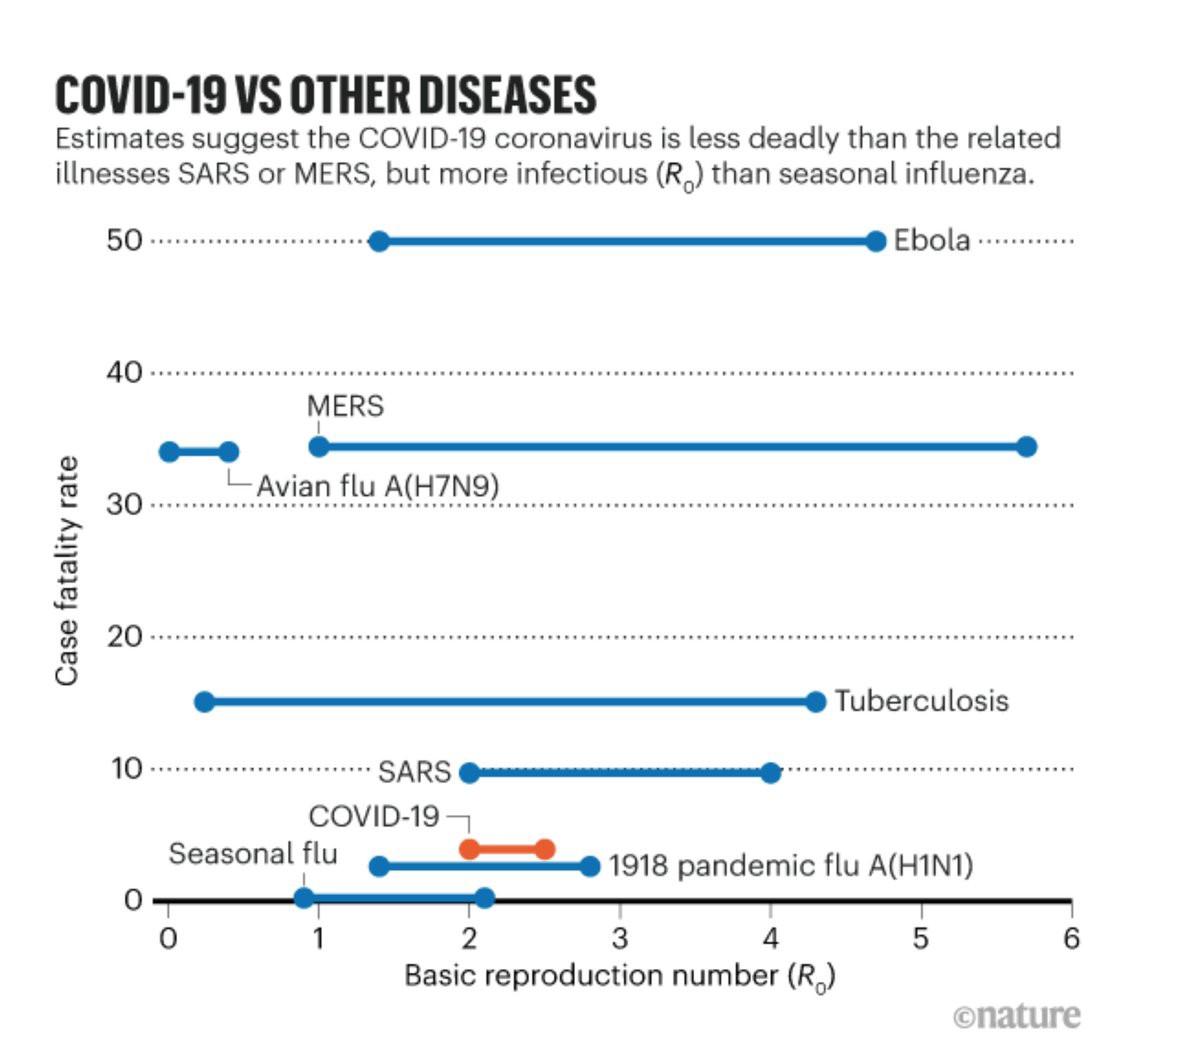
A study of about half deaths within the US (154 of 264), almost all fit a similar demographic profile as the other global ~11,000 fatalities. Another analysis by Nature,
comparing the fatality rate (since revised down) and infectious rate of
COVID-19 to other illnesses. COVID-19 is now within range of its other
sisters of less potent coronaviruses.
As the global health community continues to gather and report data, the claim that “COVID-19 isn’t just like the flu” (though still severe) is looking less credible as fatality rates continue to decline and measuring of mild cases increases.
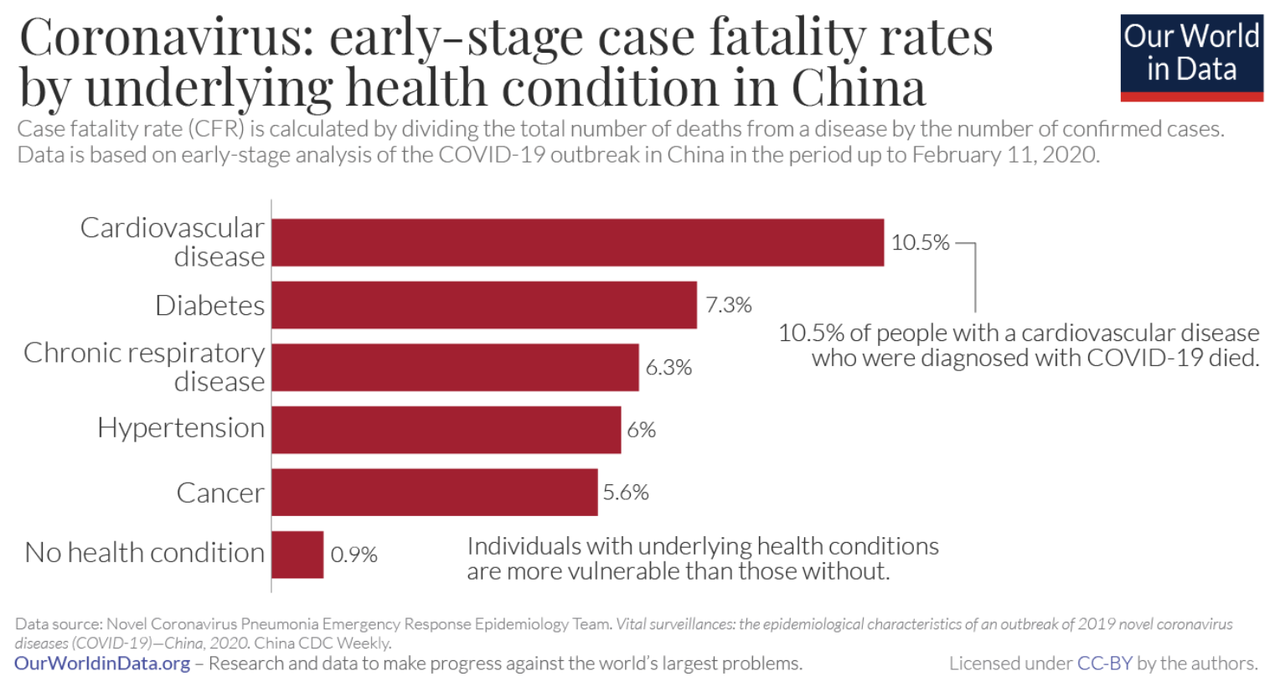
It is important to consider case-mix when looking at fatality rates.
The fatality rate is significantly higher for patients with an
underlying condition.
The fatality rates by underling condition mimics the rise in the average fatality rate with those with underlying conditions who get the seasonal flu.
Pneumonia and influenza: 1.53% — 1.93%
Chronic lower respiratory disease: 1.48% — 1.93%
All respiratory causes: 3.04% — 4.14%
Heart disease: 3.21% — 4.4%
Cancer: 0.68% — 1.05%
Diabetes: 0.26% — 0.39%
For all underlying conditions: 10.17% — 13.67%.
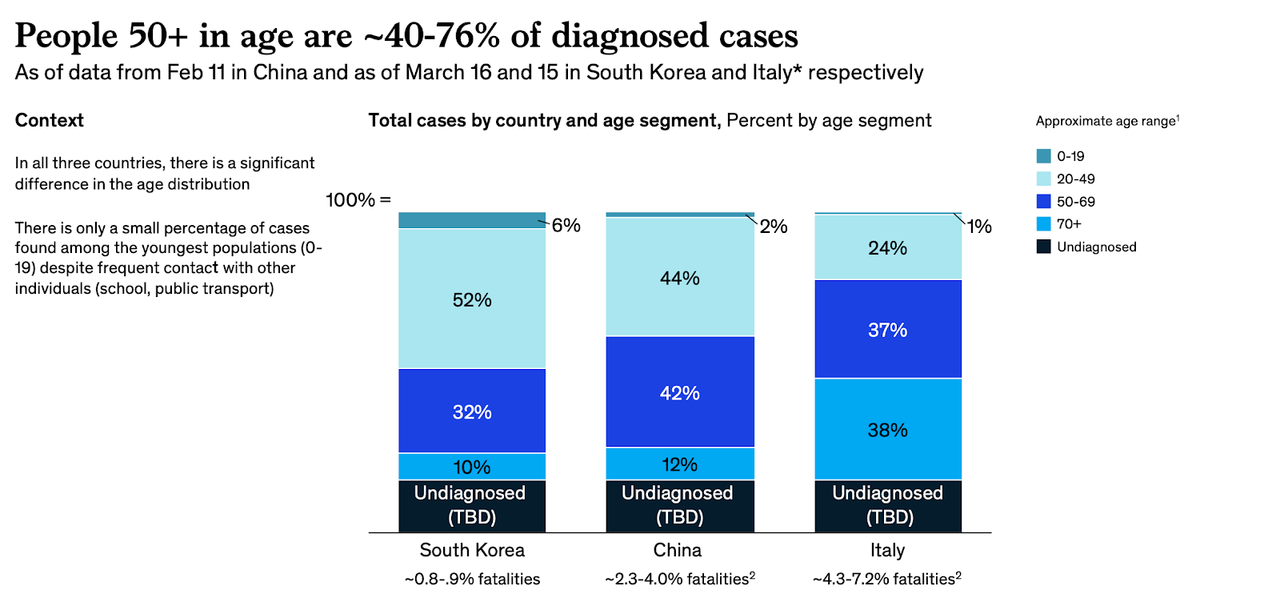
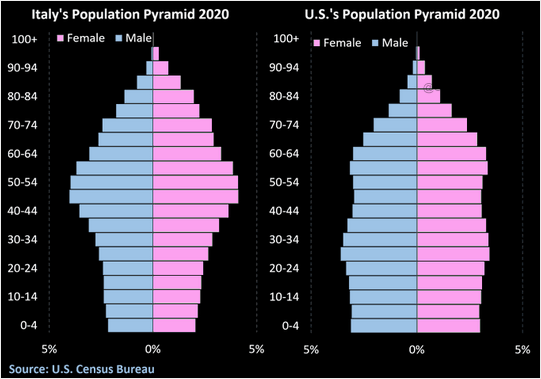
Comparing case-mix across countries with a wide range of
fatality (China and Italy) and those with low fatality rates (S. Korea)
reveals a stark difference in age; therefore, underlying conditions also
vary significantly across countries. These two factors contribute the
most to a country’s fatality rate. Source: Goldman Sachs
Divided by most at risk and low risk, Italy had significantly more cases of high at-risk patients than Germany or Korea Source: https://medium.com/@andreasbackhausab/coronavirus-why-its-so-deadly-in-italy-c4200a15a7bf
Based on an initial CDC study of 2,449 COVID-19 cases (almost
half of current US cases have missing demographic data), the United
States case-mix looks more like S. Korea and Germany rather than China
or Italy. Approximately 69% of COVID-19 cases are in the lower at-risk
population of under 65, while 31% are older than 65 higher risk
population. This suggests the US will experience a declining fatality rate; however, the US has over 100 million adults with underlying and chronic illnesses that will negatively impact our fatality rate.
An older population skew within the infected population explains most
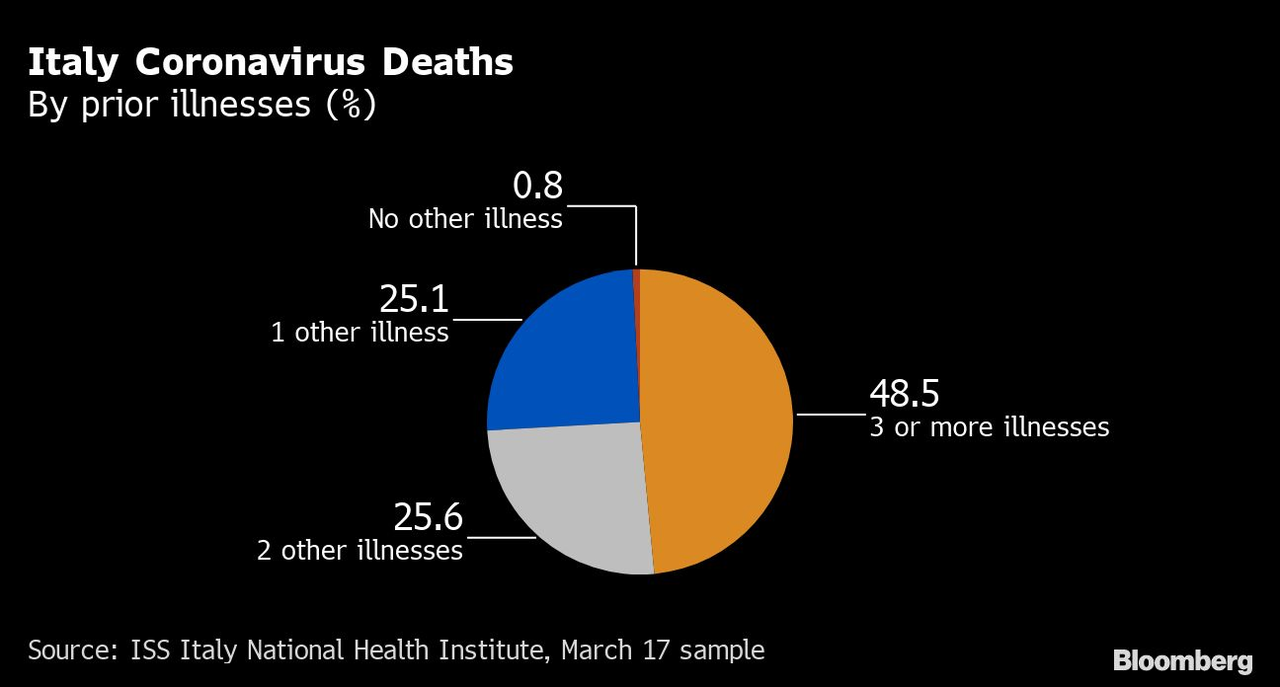
of the disparity in fatality rates between high and low countries. According to a study of the fatalities of COVID-19 cases in Italy, 99% of all deaths had an underlying pathology. Only 0.8% had no underlying condition.
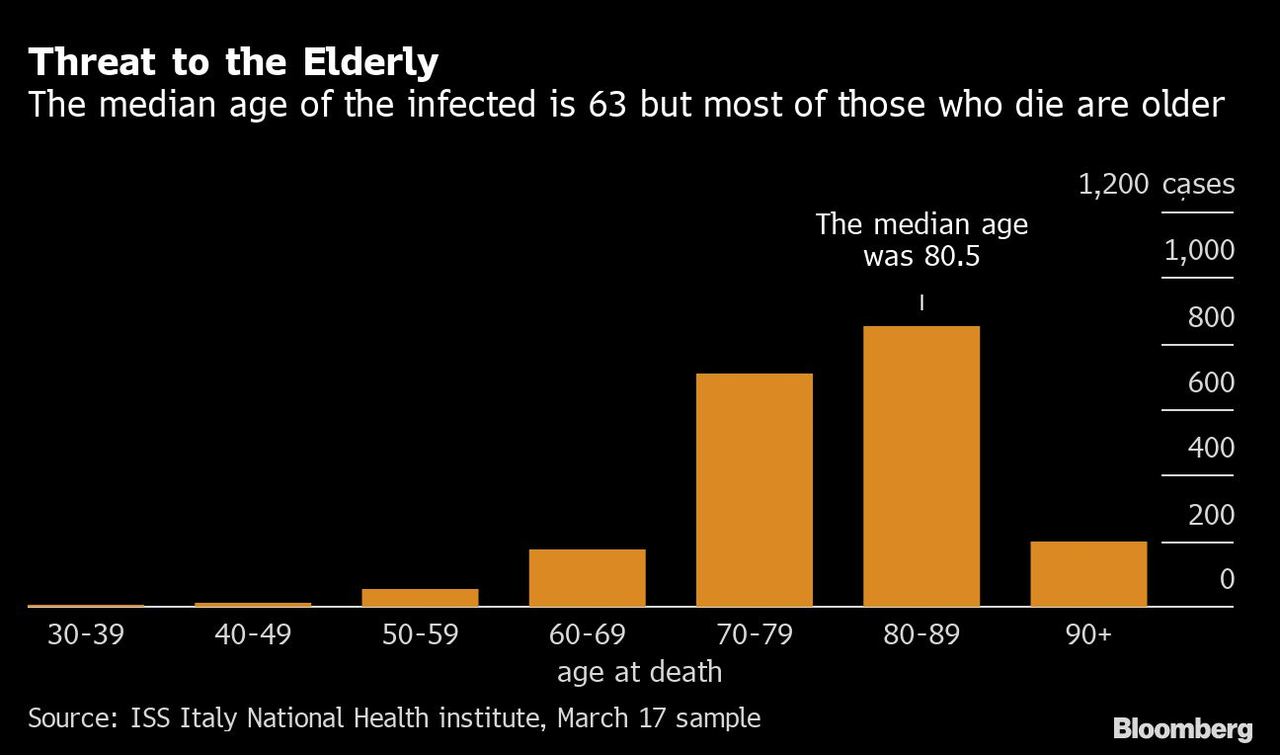
Most of those infected in Italy were over the age of 60, but the
median age of a fatality was 80. All of Italy’s fatality under the age
of 40 were males with serious pre-existing medical conditions.
This doesn’t factor in a wide variance in healthcare capacity, such as hospital beds per 1,000 citizens which could affect health outcomes; however, this doesn’t seem to be highly correlated with fatality rates at this moment.
S. Korea — 11.5
Germany — 8.3
China — 4.2
Italy — 3.4
United States — 2.9
Singapore — 2.4
So what should we do?
The first rule of medicine is to do no harm.
Local governments and politicians are inflicting massive harm and
disruption with little evidence to support their draconian edicts. Every
local government is in a mimetic race to one-up each other in
authoritarian city ordinances to show us who has more “abundance of
caution”. Politicians are competing, not on more evidence or more
COVID-19 cures but more caution. As unemployment rises and families feel
unbearably burdened already, they feel pressure to “fix” the situation
they created with even more radical and “creative” policy solutions.
This only creates more problems and an even larger snowball effect. The
first place to start is to stop killing the patient and focus on what
works.
Start with basic hygiene
The most effective means to reduce spread is basic hygiene.
Most American’s don’t wash their hands enough and aren’t aware of how
to actually wash your hands. Masks aren’t particularly effective if you
touch your eyes with infected hands. Ask businesses and public places to
freely distribute disinfectant wipes and hand sanitizer to the
customers and patrons. If you get sick or feel sick, stay home. These
are basic rules for preventing illness that doesn’t require trillions of
dollars.
More data
The best examples of defeating COVID-19 requires lots of data. We are very behind in measuring our population and the impact of the virus but this has turned a corner the last few days.
The swift change in direction should be applauded. Private companies
are quickly developing and deploying tests, much faster than CDC could
ever imagine. The inclusion of private businesses in developing
solutions is creative and admirable. Data will calm nerves and allow us
to utilize more evidence in our strategy. Once we have proper
measurement implemented (the ability to test hundreds every day in a
given metro), let’s add even more data into that funnel — reopen public
life.
Available modeling data indicate that early, short to medium
closures do not impact the epi curve of COVID-19 or available health
care measures (e.g., hospitalizations). There may be some impact of much
longer closures (8 weeks, 20 weeks) further into community spread, but
that modeling also shows that other mitigation efforts (e.g.,
handwashing, home isolation) have more impact on both spread of disease
and health care measures. In other countries, those places who closed
school (e.g., Hong Kong) have not had more success in reducing spread
than those that did not (e.g., Singapore).
Based on transmission evidence children are more likely to catch
COVID-19 in the home than at school. As well, they are more likely to
expose older vulnerable adults as multi-generational homes are more
common. As well, the school provides a single point of testing a large
population for a possible infection in the home to prevent community
spread.
Open up public spaces
With such little evidence of prolific community spread and our
guiding healthcare institutions reporting the same results, shuttering
the local economy is a distraction and arbitrary with limited accretive
gain outside of greatly annoying millions and bankrupting hundreds of
businesses. The data is overwhelming at this point that community-based
spread and airborne transmission is not a threat. We don’t have
significant examples of spreading through restaurants or gyms. When you
consider the environment COVID-19 prefers, isolating every family in
their home is a perfect situation for infection and transmission among
other family members. Evidence from South Korea and Singapore shows that
it is completely possible and preferred to continue on with life while
making accommodations that are data-driven, such as social distancing
and regular temperature checks.
Support business and productivity
The data shows that the overwhelming majority of the working
population will not be personally impacted, both individually or their
children. This is an unnecessary burden that is distracting resources
and energy away from those who need it the most. By preventing Americans
from being productive and specializing at what they do best (their
vocation), we are pulling resources towards unproductive tasks and
damaging the economy. We will need money for this fight.
At this rate, we will spend more money on “shelter-in-place” than if
we completely rebuilt our acute care and emergency capacity.
Source: https://www.macrobond.com/posts/blog-central-banks-go-big-covi-19-market-crash-crisis/
Americans won’t have the freedom to go help those who get sick,
volunteer their time at a hospital, or give generously to a charity.
Instead, big government came barrelling in like a bull in a china shop
claiming they could solve COVID-19. The same government that continued
to not test incoming passengers from Europe and who couldn’t manufacture
enough test kits with two months' notice.
Let Americans be free to be a part of the solution, calling us to a
higher civic duty to help those most in need and protect the vulnerable.
Not sitting in isolation like losers.
People fear what the government will do, not an infection
Rampant hoarding and a volatile stock market aren’t being driven by COVID-19. An overwhelming majority of American’s don’t believe they will be infected.
Rather hoarding behavior strongly demonstrates an irrational hysteria,
from purchasing infective household masks to buying toilet paper in the
troves. This fear is being driven by government action, fearing what the
government will do next. In South Korea, most citizens didn’t fear infection but the government and public shaming.
By presenting a consistent and clear plan that is targeted and specific
to those who need the most help will reduce the volatility and
hysteria. A sign the logic behind these government actions aren’t widely
accepted, nor believed as rational by the American people is the
existence itself of the volatility and hysteria. Over three-fourths of
Americans are scared not of COVID-19 but what it is doing to our society.
In CDC’s worst-case scenario, CDC expects more than 150–200 million infections within
the US. This estimate is hundreds of times bigger than China’s
infection rate (30% of our population compared to 0.006% in China). Does
that really sound plausible to you? China has a sub-par healthcare
system, attempted to suppress the news about COVID-19 early on, a lack
of transparency, an authoritarian government, and millions of Chinese
traveling for the Lunar Festival at the height of the outbreak. In the
US, we have a significant lead time, several therapies proving successful, transparency, a top tier healthcare system, a democratic government, and media providing ample accountability.
Infection isn’t our primary risk at this point.
Expand medical capacity
COVID-19 is a significant medical threat that needs to be tackled, both finding a cure and limiting spread; however, some would argue that a country’s authoritarian response to COVID-19 helped stop the spread. Probably not. In South Korea and Taiwan,
I can go to the gym and eat at a restaurant which is more than I can
say about San Francisco and New York, despite a significantly lower
caseload on a per-capita basis.
None of the countries the global health authorities admire for their
approach issued “shelter-in-place” orders, rather they used data,
measurement,and promoted common sense self-hygiene.
Does stopping air travel have a greater impact than closing all
restaurants? Does closing schools reduce the infection rate by 10%? Not
one policymaker has offered evidence of any of these approaches.
Typically, the argument given is “out of an abundance of caution”. I
didn’t know there was such a law. Let’s be frank, these acts are
emotionally driven by fear, not evidence-based thinking in the process
of destroying people’s lives overnight. While all of these decisions are
made by elites isolated in their castles of power and ego, the shock is
utterly devastating Main Street.
A friend who runs a guy will run out of cash in a few weeks. A friend
who is a pastor let go of half of his staff as donations fell by 60%. A
waitress at my favorite breakfast place told me her family will have no
income in a few days as they force the closure of restaurants. While
political elites twiddle their thumbs with models and projections based
on faulty assumptions, people’s lives are being destroyed with Marxian
vigor. The best compromise elites can come up with is $2,000.
Does it make more sense for us to pay a tax to expand medical
capacity quickly or pay the cost to our whole nation of a recession?Take
the example of closing schools which will easily cost our economy $50
billion. For that single unanimous totalitarian act, we could have built
50 hospitals with 500+ beds per hospital.
Eliminate arcane certificate of need and expand acute medical
capacity to support possible higher healthcare utilization this season.
Don’t let them forget it and vote
These days are precarious as Governors float the idea of martial law for not following “social distancing”, as well as they liked while they violate those same rules on national TV. Remember this tone is for a virus that has impacted 0.004% of our population. Imagine if this was a truly existential threat to our Republic. The COVID-19 hysteria is pushing aside our protections as
individual citizens and permanently harming our free, tolerant, open
civil society. Data is data. Facts are facts. We should be
focused on resolving COVID-19 with continued testing, measuring, and be
vigilant about protecting those with underlying conditions and the
elderly from exposure. We are blessed in one way, there is an election
in November. Never forget what happened and vote. You may ask yourself. Who is this guy? Who is this author? I’m a
nobody. That is also the point. The average American feels utterly
powerless right now. I’m an individual American who sees his community
and loved ones being decimated without given a choice, without empathy,
and while the media cheers on with high ratings. When this is all over, look for massive confirmation bias and pyrrhic celebration by elites.
There will be vain cheering in the halls of power as Main Street sits
in pieces. Expect no apology, that would be political suicide. Rather,
expect to be given a Jedi mind trick of “I’m the government and I
helped.”
The health of the State will be even stronger with more Americans
dependent on welfare, another trillion stimulus filled with pork for
powerful friends, and a bailout for companies that charged us $200
change fees for nearly a decade. Washington DC will be fine. New
York will still have all of the money in the world. Our communities
will be left with nothing but a shadow of the longest bull market in the
history of our country.


No comments:
Post a Comment