A Guide to Mass Shootings in America
There have been at least 72 in the last three decades—and most of the killers got their guns legally.
| Updated: October 2, 2015, 7:30 PM ET
Editor's note, October 2, 2015: We have updated this database with the mass shooting at Umpqua Community College in Oregon, in which nine were murdered and nine others wounded. The previous update was in July, with the attack at a military center in Chattanooga, Tennessee, which came a month after the one at a historic black church in Charleston, South Carolina. The interactive map below and our downloadable database, first published in July 2012, have been expanded with 10 additional cases from 2013-2015.* Other public shooting attacks in that period—such as a rampage at Fort Hood, another in Isla Vista, California, another on a bridge in Wisconsin, and another at a movie theater in Louisiana—have
not been added because there were fewer than four victims shot to death
in each of those cases. For more about that distinction and its
limitations, see this piece and this piece.
It is perhaps too easy to forget how many times this has happened. The horrific massacre at a movie theater in Aurora, Colorado, in July 2012, another at a Sikh temple in Wisconsin that August, another at a manufacturer in Minneapolis that September—and then the unthinkable nightmare at a Connecticut elementary school
that December—were some of the latest in an epidemic of such gun
violence over the last three decades. Since 1982, there have been at
least 72 public mass shootings across the country, with the killings
unfolding in 31 states from Massachusetts to Hawaii. Thirty-five of
these mass shootings have occurred since 2006. Seven of them took place
in 2012 alone, including Sandy Hook. A recent analysis of this database
by researchers at Harvard University, further corroborated by a recent
FBI study, determined that mass shootings have been on the rise.We've gathered detailed data on more than three decades of cases and mapped them below, including information on the attackers' profiles, the types of weapons they used, and the number of victims they injured and killed. The following analysis covers our original dataset comprised of 62 cases from 1982-2012.

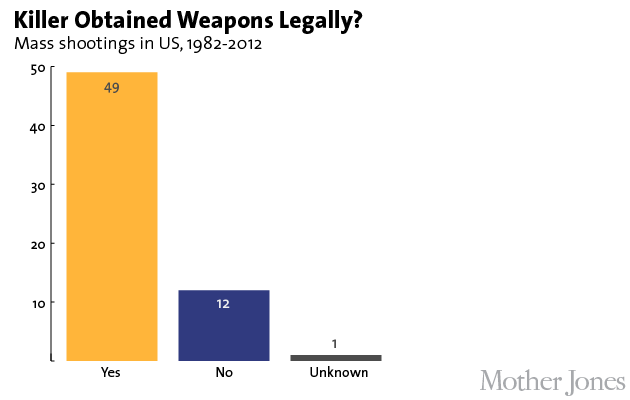
Weapons: Of the 143 guns possessed by the killers, more than three quarters were obtained legally. The arsenal included dozens of assault weapons and semi-automatic handguns with high-capacity magazines. (See charts below.) Just as a perpetrator used a .40-caliber Glock to slaughter students in Red Lake, Minnesota, in 2005, so too did the one in Aurora, along with an AR-15 assault rifle, when blasting away at his victims in a darkened movie theater. In Newtown, Connecticut, the attacker wielded a .223 Bushmaster semi-automatic assault rifle as he massacred 20 school children and six adults.
The perpetrators: More than half of the cases involved school or workplace shootings (12 and 20, respectively); the other 30 cases took place in locations including shopping malls, restaurants, and religious and government buildings. Forty-four of the killers were white males. Only one was a woman. (See Goleta, Calif., in 2006.) The average age of the killers was 35, though the youngest among them was a mere 11 years old. (See Jonesboro, Ark., in 1998.) A majority were mentally troubled—and many displayed signs of mental health problems before setting out to kill. Explore the map for further details—we do not consider it to be all-inclusive, but based on the criteria we used, we believe that we've produced the most comprehensive rundown available on this particular type of violence. (Mass shootings represent only a sliver of America's overall gun violence.) For the stories of the 151 shooting rampage victims of 2012, click here, and for our groundbreaking investigation into the economic costs of the nation's gun violence, including mass shootings, click here.
Click on the dots or use the search tool in the top-right corner of the map to go to a specific location. (Zoom in to find cases located geographically close together in Colorado, Texas, Wisconsin, and elsewhere.)
Sources: Research by Mother Jones. (With thanks to the Associated Press, Canada.com, and Citizens Crime Commission of NYC.)
Our focus is on public mass shootings in which the
motive appeared to be indiscriminate killing. We used the following
criteria to identify cases:
- The shooter took the lives of at least four people. An FBI crime classification report identifies an individual as a mass murderer—versus a spree killer or a serial killer—if he kills four or more people in a single incident (not including himself), typically in a single location.
- The killings were carried out by a lone shooter. (Except in the case of the Columbine massacre and the Westside Middle School killings, which involved two shooters.)
- The shootings occurred in a public place. (Except in the case of a party on private property in Crandon, Wisconsin, and another in Seattle, where crowds of strangers had gathered.) Crimes primarily related to gang activity, armed robbery, or domestic violence in homes are not included.
- If the shooter died or was hurt from injuries sustained during the incident, he is included in the total victim count. (But we have excluded many cases in which there were three fatalities and the shooter also died, per the above FBI criterion.)
- We included a handful of cases also known as "spree killings"—cases in which the killings occurred in more than one location over a short period of time, that otherwise fit the above criteria.
Here are two charts detailing the killers' weapons:

This guide was first published on July 20, 2012. Since
then, we've updated and expanded it multiple times with additional
research and reporting. The analysis and charts above cover the data
through 2012 (comprising 62 cases); additional data and analysis on the
shooters' weapons are in this story. Information on eight additional mass shootings from 2013 to 2015 is included on the map and in our full data set here. For much more of our reporting on mass shootings, gun violence, and gun laws, see our special investigations: America Under the Gun, Newtown: One Year After, and The True Cost of Gun Violence. (Return to intro.)

No comments:
Post a Comment