Satellite Data Proves Changes in Sun Caused Recent Global Warming, Not Humans
Written by Ross McLeodThe ‘science’ for dangerous man-made global warming continues to unravel as proven by independent Australian climate researcher, Ross McLeod.
 Here
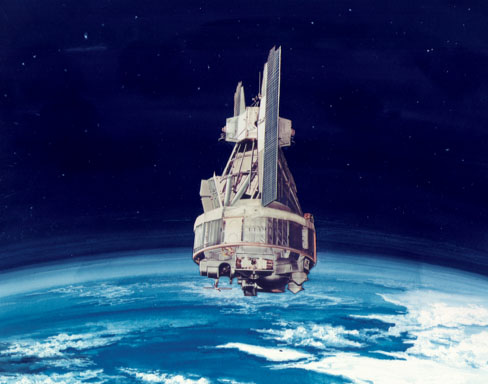
he explains how measurements of solar cycles from the reliable Nimbus
Satellite (pictured) better fits Earth’s warming and cooling than human
emission of carbon dioxide (CO2).
Here
he explains how measurements of solar cycles from the reliable Nimbus
Satellite (pictured) better fits Earth’s warming and cooling than human
emission of carbon dioxide (CO2).McLeod explains:
I remember climate scientist Roy Spencer was roundly criticised for once stating an obvious fact in relation to climate alarm about “heat trapping” CO2 and the calamity that awaited mankind if fossil fuels did not remain in the ground.
He simply stated that satellites have measured that Earth has been emitting more radiation to space over the recent decades.
Alarmists assumed this was an all-out attack on the hypothesis of the enhanced greenhouse gas effect.
At the time I did a little bit of research and discovered that 2005 was the 40th anniversary of the Nimbus satellite program. The series of Nimbus satellites provided ground breaking information about Earth’s weather systems.
But why are information sites such as this full of condescending misinformation?
http://earthobservatory.nasa.gov/Features/Nimbus/nimbus2.php
“The Earth’s Radiation Budget
When it comes to climate and climate change, the Earth’s radiation budget is what makes it all happen. Swathed in its protective blanket of atmospheric gases against the boiling Sun and frigid space, the Earth maintains its life-friendly temperature by reflecting, absorbing, and re-emitting just the right amount of solar radiation. To maintain a certain average global temperature, the Earth must emit as much radiation as it absorbs. If, for example, increasing concentrations of greenhouse gases like carbon dioxide cause Earth to absorb more than it re-radiates, the planet will warm up.”
Just what is our protective blanket of atmospheric gases protecting us against anyway?
“frigid space” ?
What does “frigid space” have to do with the space surrounding Earth at its orbit around the Sun???
The Sun has a surface temperature of 5778 Kelvin and emits of the order of 63,290,000 Wm-2 over every square metre of the photosphere. By the inverse square law this staggering power is reduced to ~1368 Wm-2 at the distance the Earth is from the Sun.
http://nssdc.gsfc.nasa.gov/planetary/factsheet/sunfact.html
A simple Stefan-Boltzmann calculation establishes this radiation power is capable of easily boiling water at Earth’s orbit – ~120 degrees C. Even as far away as Mars the solar radiation is capable of inducing a temperature of ~319 Kelvin or ~46 degrees C in any object that absorbs significant quantities of it.
http://nssdc.gsfc.nasa.gov/planetary/factsheet/marsfact.html
How could any rational person call that “frigid”?
Being heated to 46 degrees C by absorbing significant quantities of the solar radiation cannot be described as frigid. The huge sphere mapped out by Mars’ orbit is not “frigid space” by any stretch of the imagination.
To further illustrate just how ludicrous this ridiculous claim is consider that at Earth’s orbit there are basically only two ways to avoid this extremely powerful radiation – reflect it away or hide behind some large object like a planet.
But just to illustrate how insignificant “hiding behind a planet” is this is a NASA photo of Venus transiting the Sun:-
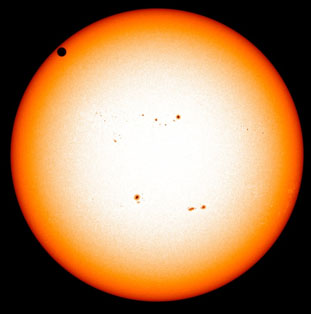
As is plainly obvious Venus – the small black dot top left – makes no significant difference to the amount of radiation between the Earth and the Sun.
For educated people to claim that “frigid space” is a realistic description of any of the space contained in the huge “sphere” mapped by the orbit of Mars simply beggars belief.
Are the people who write gobbledygook like this simply too stupid to describe or are they deliberately practicing misinformation to bolster a hypothesis?
Then we have the radiation “heat” trapping statement – “If, for example, increasing concentrations of greenhouse gases like carbon dioxide cause Earth to absorb more than it re-radiates, the planet will warm up.”
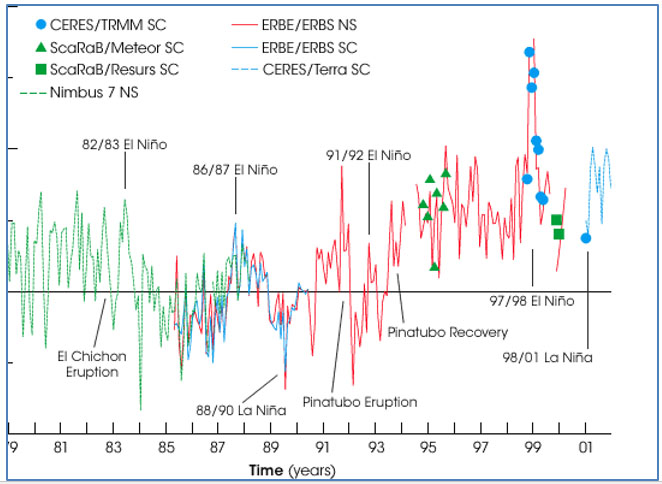
Then they produce the graph (above) from 1979 to 2005 – why they ignored the period 1965 to 1979 – more than a third of the time period – is anyone’s guess (but I am suspicious) – after all it was the 40th anniversary!
Surely the graph completely dispels the “heat” trapping causing warming hypothesis. It clearly shows Earth radiating more over the time frame – not less – the radiation anomaly is positive over almost all of the period with the “dips” explained by volcanic aerosols or La-Nina. But how can the atmosphere trap radiation and yet at the same time emit more radiation? Surely that is the classic oxymoron?
Surely this graph is a clear representation of response to an external forcing due to the only one we have – the Sun?
Of course the classic response from climatologists is that the changes in the Sun’s TSI are too small to account for observed warming.
But how often do they tell us that during the latter half of the 20th century the Sun went through a series of the most active solar cycles ever observed – by sunspot count alone these cycles are ranked 1 – 4?
http://www.sws.bom.gov.au/Educational/2/3/2
Solar cycle 19 reached maximum in 1958 – number 1 most active solar cycle ever reliably observed.
Solar cycle 21 reached maximum in 1979 – number 2 most active solar cycle ever reliably observed.
Solar cycle 22 reached maximum in 1989 – number 3 most active solar cycle ever reliably observed.
Solar cycle 18 reached maximum in 1947 – number 4 most active solar cycle ever reliably observed.
Solar cycle 20 reached maximum in 1968 – and even though a weak cycle it still ranked number 6 most active solar cycle observed in the 20th century – leading to the 1970’s cooling scare.
But the article isn’t merely about the series of solar maximums but rather about how unique cycle 22 was.
Is it coincidence that a series of the most active solar cycles ever reliably observed correlates with a period of global warming in the latter half of the 20th century?
Is it coincidence that Solar cycle 23 was significantly less active – ranking number 5 compared to the 20th century and only marginally higher than the weakest of any cycle since 1937 – while Solar cycle 24 “is on track to be the Solar Cycle with the lowest recorded sunspot activity since accurate records began in 1750” and satellite data tell us there has been no significant global warming since the 1997/98 El-Nino?
Surely no-one expects something as large and complex as Earth’s climate system to react to changes in solar forcing in a time frame of less than perhaps decades?

No comments:
Post a Comment