Was early onset industrial-era warming anthropogenic, as Abram et al. claim?
A guest post by Nic Lewis
IntroductionA recent PAGES 2k Consortium paper in Nature,[i] Abram et al., that claims human-induced, greenhouse gas driven warming commenced circa 180 years ago,[ii] has been attracting some attention. The study arrives at its start dates by using a change-point analysis method, SiZer, to assess when the most recent significant and sustained warming trend commenced. Commendably, the lead author has provided the data and Matlab code used in the study, including the SiZer code.[iii]
Their post-1500 AD proxy-based regional reconstructions are the PAGES2K reconstructions, which have been discussed and criticized on many occasions at CA (see tag), with the Gergis et al 2016 Australian reconstruction substituted for the withdrawn version. I won’t comment on the validity of the post-1500 AD proxy-based regional reconstructions on which the observational side of their study is based – Steve McIntyre is much better placed than me to do so.
However, analysis of those reconstructions can only provide evidence as to when sustained warming started, not as to whether the cause was natural or anthropogenic. In this post, I will examine and question the paper’s conclusions about the early onset of warming detected in the study being attributable to the small increase in greenhouse gas emissions during the start of the Industrial Age.
The authors’ claim that the start of anthropogenic warming can be dated to the 1830s is based on model simulations of climate change from 1500 AD on.[iv] A simple reality check points to that claim being likely to be wrong: it flies in the face of the best estimates of the evolution of radiative forcing. According to the IPCC 5th Assessment [Working Group I] Report (AR5) estimates, the change in total effective radiative forcing from preindustrial (which the IPCC takes as 1750) to 1840 was –0.01 W/m2, or +0.01 W/m2 if changes only in anthropogenic forcings, and not solar and volcanic forcings, are included. Although the increase in forcing from all greenhouse gases (including ozone) is estimated to be +0.20 W/m2 by 1840, that forcing is estimated to be almost entirely cancelled out by negative forcing, primarily from anthropogenic aerosols and partly from land use change increasing planetary albedo.[v] Total anthropogenic forcing did not reach +0.20 W/m2 until 1890; in 1870 it was still under +0.10 W/m2.
It is not credible that a negligible increase of 0.01 W/m2 would have had any measurable effect on ocean or land temperatures globally; it is doubtful that an increase of 0.1 W/m2 would do so. Even a change of 0.20 W/m2 would have affected global mean surface temperature (GMST) by less than 0.1°C. Moreover, anthropogenic aerosol and land use change forcing was concentrated in the Northern hemisphere extratropics and the tropics, with little in the Southern extratropics, which would suggest that the onset of positive net anthropogenic forcing (and hence anthropogenic warming) in the tropics and Northern hemisphere extratropics would have been delayed until circa 1870. Yet it is in those regions that Abrams et al. find the earliest onset of anthropogenic warming.
It is possible that AR5 best estimates overstate the strength of anthropogenic aerosol forcing, with the result that total anthropogenic forcing became positive enough to have a measurable impact on temperatures at an earlier date than if those estimates were correct. However, if so, that is good news. It would imply that climate sensitivity – both transient and equilibrium – is lower than current best estimates based on AR5 forcing values suggest, since the observed warming over the industrial era would then have been produced by a larger increase in forcing.
The influence of volcanism on the diagnosed early onset dates of warming
How, then, are the study’s results to be explained? The study’s change point analysis, whilst interesting, seems to me an unsuitable method of detecting the onset of anthropogenic warming. One would expect to find a change of slope in global temperature somewhere – depending on natural internal climate variability – around the late 1830s,. That is because, although anthropogenic forcing did not become significant until much later in the 19th century, there was a big change in average volcanic forcing at that time. Over the industrial period (taken as 1750–2015) as a whole, on the AR5 best estimate basis volcanic forcing averaged –0.4 W/m2. Whilst it averaged close to that level during the last four decades of the 18th century, during the first four decades of the 19th century there was heavy volcanic activity,[vi] with (according to IPCC AR5 estimates) forcing averaging –1.0 W/m2. By contrast, volcanic forcing over the next four decades was small, averaging only –0.1 W/m2. The resulting +0.9 W/m2, change in average forcing is several times larger than the total change in anthropogenic forcing over the whole of the 19th century.
I would expect that pattern of forcing to produce, on a decadal mean basis, a depressed GMST level from circa 1800 to the late 1830s followed by a recovery. In the 1880s, when volcanic activity was again high (Krakatau), one might expect an interruption in the upward movement. However, Atlantic multidecadal variability is thought to have commenced an extended upswing during the 1830s, peaking in the late 1800s.[vii] That would itself have produced a warming trend during that period, particularly over the Northern hemisphere. Multicentennial internal climate variability might also have had a role. Moreover, by the late 1800s anthropogenic forcing had become non-negligible at 0.25 W/m2 per AR5, so would have produced a weak warming trend on its own (although not a strong enough one to counter the effects of Atlantic – and maybe Pacific – multidecadal variability becoming negative during the first two decades of the 20th century).
Warming from the late 1830s to the late 19th century due to recovery from the heavy volcanism earlier in the century and the upswing in Atlantic multidecadal variability would have been superimposed on a slow trend of recovery in surface temperature from the Little Ice Age (LIA), as the ocean interior warmed after the end of the particularly cold four hundred year period from (according to the paper) AD 1400–1800 – a process with a similarly long timescale. The resulting temporal pattern fits the global reconstructions of surface air and sea temperature trends shown in their Figure 1c and 1d, and would account for a change point being found in the 1830s or 1840s. But it does not at all imply that anthropogenic forcing had any measurable influence before the late 1800s. The change of GMST slope circa the late 1830s, and the rise in GMST from then until the late 1800s, was likely almost entirely due to natural factors.
Abram et al. claim that diagnosis using SiZer is little affected by temporary cooling episodes, such as those produced by heavy volcanic activity. This claim is based on the results of analyses of noisy synthetic temperature time series in which gradual warming commences at a known time. They show that a decade-long downwards excursion in temperature starting 25 or 50 years before the actual warming commencement date brings forward the diagnosed warming commencement date by only five to twenty years (Extended Data Figure 3a). However, heavy volcanic activity extended over the first four decades of the 19th century, not for a single decade. Also, the assumed AR(1) annual temperature time series autocorrelation of 0.1 looks light, certainly for sea surface temperatures, where the instrumental record suggests a figure of 0.4 or so would be more realistic. Moreover, their assumed ratio of 100-yr trend to 2σ noise of 1:0.5 looks optimistic to me. In the light of these factors, it seems plausible that the cooling produced by heavy volcanism during 1800–1839 might have brought forward the diagnosed second quarter of the 19th century warming commencement dates by up to several decades from when they would otherwise have been diagnosed.
Abram et al.’s evidence for early warming being anthropogenic
The paper’s conclusions about an anthropogenic origin of the early warming onset are based on evidence summarised in their Figure 3, reproduced here as Figure 1.
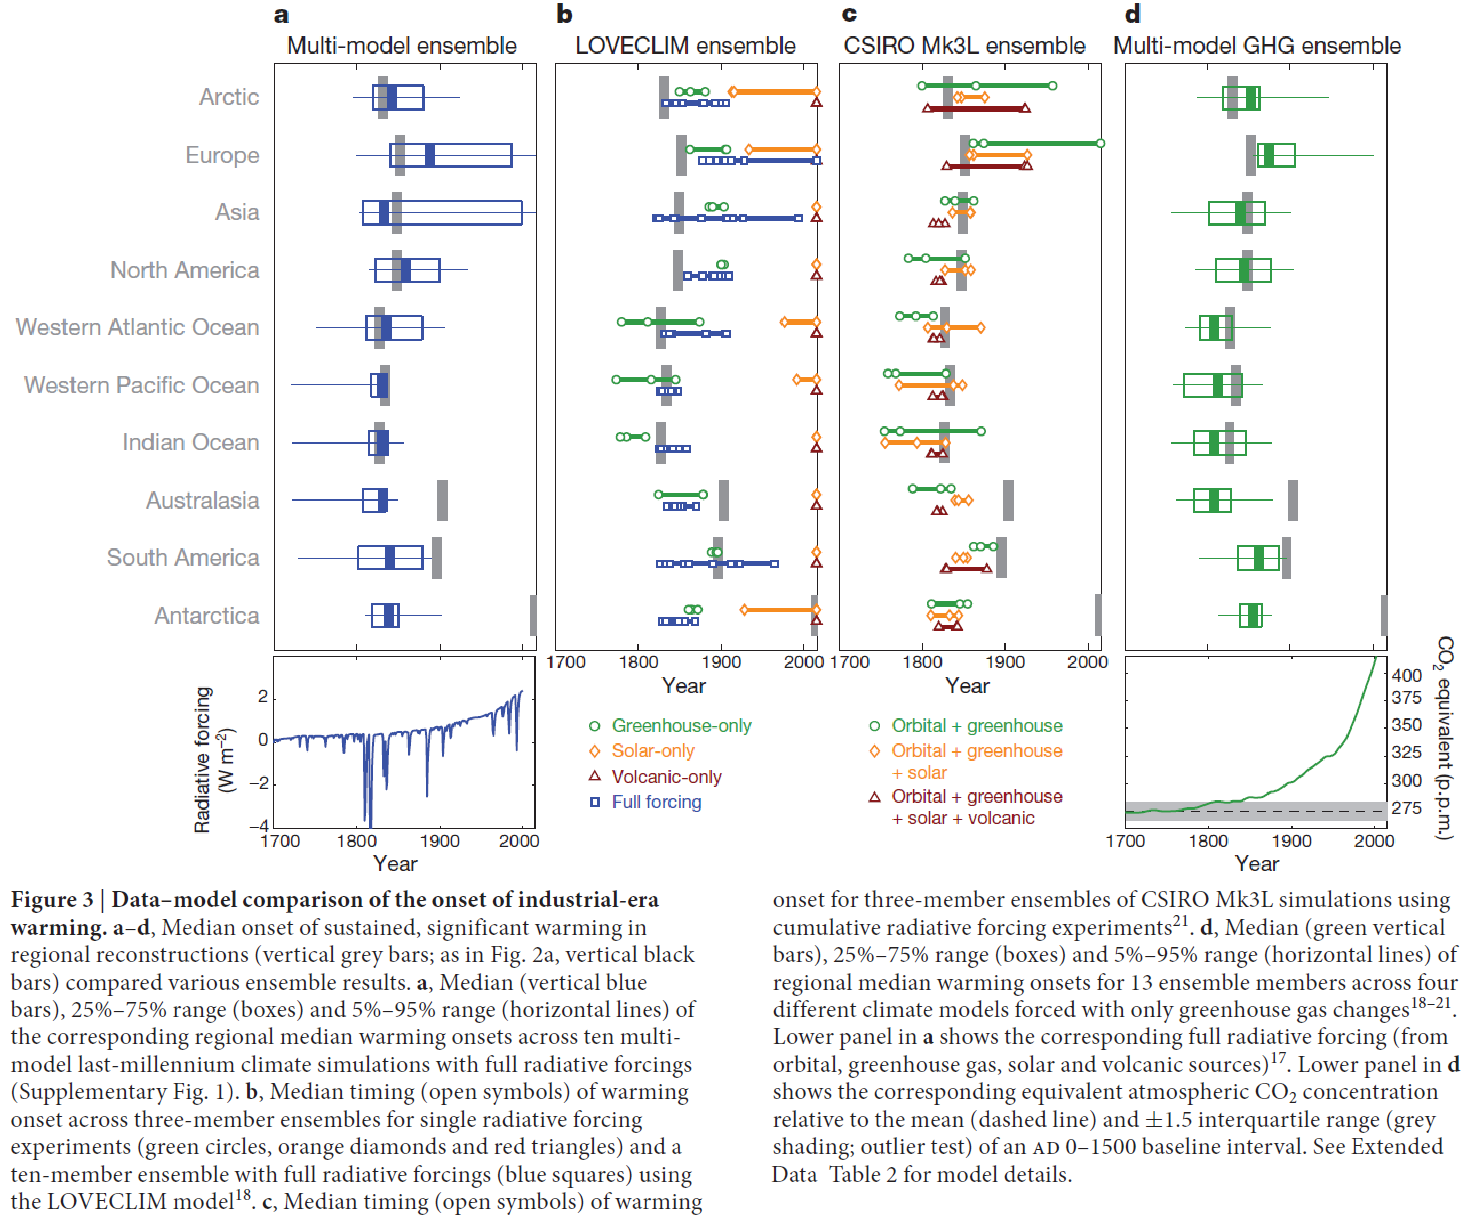
Figure 1. Reproduction of Figure 3 of Abram et al. 2016
.I will discuss each source of evidence separately, in the reverse order from where it appears in their Figure 3.
Evidence in Abrams et al. Figure 3d
The paper’s authors comment that:
“Naturally forced climate cooling may have helped to set the stage for the widespread onset of industrial-era warming in the tropical oceans and over Northern Hemisphere landmasses during the mid-nineteenth century.”
which is very true, but then go on to say:
“Simulations suggest that recovery from volcanic cooling is not an essential requirement for reproducing the mid-nineteenth-century onset of industrial-era warming. Multi-model experiments forced with only greenhouse gases capture regional onsets for sustained industrial-era warming that are consistent with the tropical ocean and Northern Hemisphere continental reconstructions (Fig 3d).”
However, this is irrelevant. It is unsurprising that model simulations forced only with greenhouse gases, as used in their Figure 3d, produce sustained warming from quite early in the industrial period. But in fact the historical forcing that produced the warming was the net sum of greenhouse gas (GHG) forcing and other forcings, which were mainly negative. As I stated, the AR5 best estimate of the sum total of historical forcings is almost zero in 1840, and only rises slowly thereafter. On a rolling 5-year average basis, estimated global total forcing doesn’t exceed 0.1 W/m2 – enough to produce, within a decade, a very small warming of 0.02 to 0.05°C – until 1901. However, GHG forcing reaches a more material level of 0.2 W/m2 in the mid-1840s – at which point total anthropogenic forcing is only 0.05 W/m2.
Evidence in Abrams et al. Figure 3c
The only anthropogenic forcing included in CSIRO-Mk3L simulations used here is from GHG. Various combinations of natural forcings were employed in addition. Accordingly, the same objections – regarding the omission of negative non-GHG anthropogenic forcing – apply here as to the Figure 3d evidence.
Evidence in Abrams et al. Figure 3b
The LOVECLIM simulations used here are stated to include “Full forcing” ones as well as GHG-only, solar only and volcanic only forcing simulations. However, Full forcing includes only GHG, land use change, solar and volcanic forcing. It does not include aerosol forcing, the dominant anthropogenic negative forcing. Accordingly, essentially the same objections apply here as to the Figure 3c and 3d evidence, albeit with slightly less force since the minor negative land use change forcing was included. Perhaps reflecting land use change forcing, in the Northern hemisphere the diagnosed warming commencement dates with Full forcing are generally several decades later than those found using the PAGES 2k reconstruction and the multimodel ensemble used for Figure 3a.
Evidence in Abrams et al. Figure 3a
This is really the crux of the evidence supplied by Abrams et al. as to an anthropogenic cause of early onset warming. The regional warming onset dates from simulations given in their Table 1, which they claim are reasonably consistent with the dates they derive from their proxy reconstructions, are based entirely on the multimodel last-millennium climate simulations to which their Figure 3a relates. They claim that these simulations, by ten models, employed full radiative forcings, both natural and anthropogenic. However, this statement appears to be incorrect.
The simulations used cover 850–2005 AD in two parts: 1000 year CMIP5 last-millennium (past1000) simulations with forcings that are consistent with the PMIP3 protocol, extended by CMIP5 historical period simulations covering 1850–2005. There are two problems with using this data.
First, the forcings PMIP3 specifies for use in last-millennium climate simulations excludes anthropogenic aerosols.[viii] That will result in anthropogenic forcing, and warming, reaching a non-negligible level at a much earlier point in the industrial period than if all anthropogenic forcings were included at AR5 best estimate values. For about half the ensemble of ten (nine in practice) models used, it appears that the last-millennium climate simulations were continued to 2005 using the same set of PMIP3 forcings, producing a quasi-historical period simulation covering 1859–2005.
Secondly, it appears that for the remainder of the ensemble of models, the main CMIP5 historical period (1850–2005) model simulations, rather than continuations of the past1000 simulations, were used to extent the past1000 PMIP3-protocol simulations. That is important since, like the past1000 simulations, the main CMIP5 historical runs were initialised by branching off from preindustrial control runs. The ocean will be substantially cooler at the end of the past1000 simulations, following the long cold 1400–1840 period, than when the historical simulations were branched off the preindustrial control simulations (which generally do not have any volcanic forcing). As a result of this discontinuity, for such models there would be an immediate jump in temperatures (ignoring any influence of internal variability) between 1849 and 1850. Allowing for a 5–20 year early bias of the SiZer change point date in the presence of a burst of previous negative forcing (Extended Data Figure 3a), such as caused by the heavy volcanism over the first four decades of the 19th century, such jumps could account for finding warming onset dates in the 1830s.
Although the inclusion of negative anthropogenic aerosol forcing in the main CMIP5 historical simulations would result in them warming at a slightly slower rate after the initial jump in 1850 than if PMIP3-protocol forcings were included, the growth in negative anthropogenic aerosol forcing between preindustrial and 1850 is, unlike the rise in GHG, generally ignored in the CMIP5 historical simulations, so aerosol forcing would start from a zero base in 1850 and so have a negligible effect over the following few decades. Moreover, two of the models involved only included direct aerosol forcing – which per AR5 accounts for only about half total aerosol forcing– in their main CMIP5 historical simulations.
To illustrate my point, I accessed the data used and extracted the model simulated temperatures for Europe, one of the regions that has a diagnosed mid-19th century warming onset from the proxy-based reconstructions, with onset diagnosed later in the 19th century from the multi-model reconstructions. Figure 2 shows the various time series, averaged pentadally in order to reduce annual climate noise.
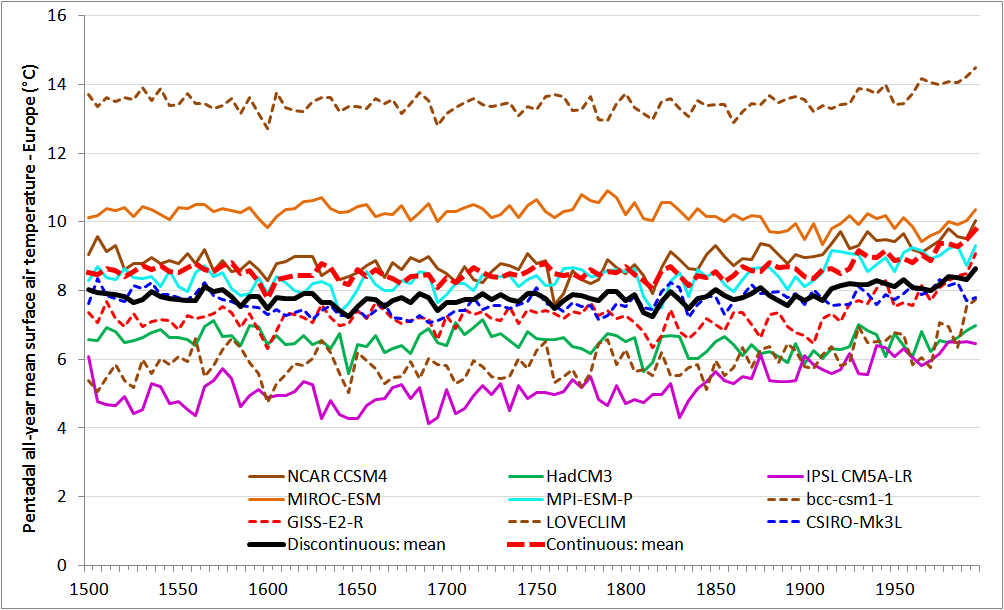
Figure 2: Multimodel simulated surface temperature in Europe (pentads starting in year shown)
.Results from the four models that appear to have generated simulations over 1850–2005 by continuing the last millennium simulations are shown by dashed lines; the thick red line shows their mean. None of these models included anthropogenic aerosol forcing. Results from the five models that appear to have generated simulations over 1850–2005 by branching from the (warmer) preindustrial control simulation are shown by solid lines; the thick black line shows their mean.[ix]
Although difficult to see in the figure, the mean of the discontinuous models shows a jump from the 1840-49 average to the 1850–55 average temperature, of 0.23°C. By contrast, the mean for the continuous models shows an increase of only 0.05°C. I have chosen these periods as they are the longest ones straddling the start of 1850 transition from the last millennium simulations to the 1850–2005 ones that are unaffected by contemporaneous or very recent volcanic activity. Repeating the exercise for temperatures in Asia and North America, where the warming onsets dates diagnosed from the simulations straddled the 1840s, showed a mean excess for the discontinuous models, in the difference between the mean 1840-49 and 1850–55 averages, of 0.17°C, similar to that for Europe.[x] The much larger increase for the discontinuous models between the mean temperatures for these periods very much supports my argument that their historical simulations started from a warmer state than their past1000 simulations ended in.
Conclusions
It appears that the claim in Abrams et al. that the diagnosed early onset – about 180 years ago in some regions – of industrial-era warming is of anthropogenic origin is based on inappropriate evidence that does not substantiate that claim, which is very likely incorrect. Most of the evidence given for the anthropogenic origin claim, which is entirely model-simulation based, ignores the industrial era increase in aerosol forcing, the dominant negative (cooling) anthropogenic forcing; the remaining evidence appears to be invalidated by a simulation discontinuity in 1850. The only evidence provided that includes even the post 1850 increase in anthropogenic aerosol forcing – half of the Figure 3a multi-model ensemble simulations – is affected by the simulations from 1850 on being started with the ocean significantly warmer than it was in 1849.
Recovery from the heavy volcanism earlier in the century and an upswing in Atlantic multidecadal variability, superimposed on a slow trend of recovery in surface temperature from the LIA as the ocean interior warmed after the end of the particularly cold four hundred year period from AD 1400–1800, appears adequate to account for warming from the late 1830s to the final quarter of the 19th century. It is unlikely that anthropogenic forcing, estimated to be very low until the 1870s, played any part in warming before then. The heavy volcanism in the first four decades of the 19th century likely caused the warming onset dates diagnosed from the proxy data, at least, to be up to several decades earlier than they would have been in its absence.
Ironically, should the study’s finding of anthropogenic warming starting as early as circa the 1830s be correct, it would imply that anthropogenic aerosol forcing is weaker than estimated in IPCC AR5, and therefore that observational estimates of climate sensitivity (both transient and equilibrium) based on AR5 forcing values need to be revised downwards. That is because total anthropogenic forcing would only have become positive enough to have had any measurable impact on temperatures in the 1830s if AR5 best estimates significantly overstate the strength of anthropogenic aerosol forcing.
Nicholas Lewis August 2016
[i] Abram NJ et al. (2016) Early onset of industrial-era warming across the oceans and continents. Nature, doi:10.1038/nature19082. In archive FAQ_&_supporting_docs.zip available at https://cloudstor.aarnet.edu.au/plus/index.php/s/4pQheVzMddCXwJN
[ii] Around the 1830s in the tropical oceans and the Arctic, and around the 1840s in North America, Asia and Europe.
[iii] http://www.ncdc.noaa.gov/paleo/study/20083
[iv] The past1000 CMIP5/PMIP3 simulations used commence in 800 AD, and are extended from 1849 to 2005, but Abram et al only use the 1500–1999 AD portion.
[v] Per AR5 best estimates, total aerosol forcing was over four times as strong as land use change forcing (which was also negative) throughout the 1800s.
[vi] Very high volcanic forcing of –1.0 W/m2 in the decade to 1810 was followed by extremely high forcing of –2.1 W/m2 in the next decade due to the eruption of Tambora in 1815, which balanced out with the volcano-free 1820s, and forcing again very high at –1.1 W/m2 in the fourth decade due to the 1835 Cosiguina eruption.
[vii] Delworth, T. L., and M. Mann (2000), Observed and simulated multidecadal variability in the Northern Hemisphere, Clim. Dyn., 16, 661–676, doi:10.1007/s003820000075. ( A smoothed version shown in Figure 2(d) of Chylek P et al. (2011) GRL 38, L13704, doi:10.1029/2011GL047501.)
[viii] PMIP3 also excludes other anthropogenic non-greenhouse gas forcings other than land use change.
[ix] The tenth model, Fgoals-s2, did not generate the requisite surface air temperature data.
[x] The average across the three regions of differences in mean 1840-49 and 1850–55 temperatures based on taking multi-model medians rather than means is even larger, at 0.28°C.

No comments:
Post a Comment