What Was Earth’s Preindustrial Global Mean Surface Temperature, In Absolute Terms Not Anomalies, Supposed to Be?
The answers may surprise you.
THIS POST HAS BEEN UPDATED. The update is near the end of the post.
Recently, the Intergovernmental Panel on Climate Change (IPCC) and the U.S. Global Change Research Program (USGCRP) have cranked up their alarmist propaganda, with the IPCC now pushing the goal of limiting global warming to 1.5 deg C above preindustrial global surface temperatures.
That, of course, initiates the title question, What Was Earth’s Preindustrial Global Mean Surface Temperature, In Absolute Terms Not Anomalies, Supposed to Be?
Four years ago, in the post On the Elusive Absolute Global Mean Surface Temperature – A Model-Data Comparison (WattsUpWithThat cross post is here), we illustrated and discussed the wide (3-deg C) span in the climate model simulations of global surface temperatures on an absolute, not anomaly, basis. Figure 1 below is Figure 5 from that post. In that post, we started the graphs in the year 1880 because the GISS Land-Ocean Temperature Index (LOTI) and NOAA NCDC (now NOAA NCEI) data started that year.
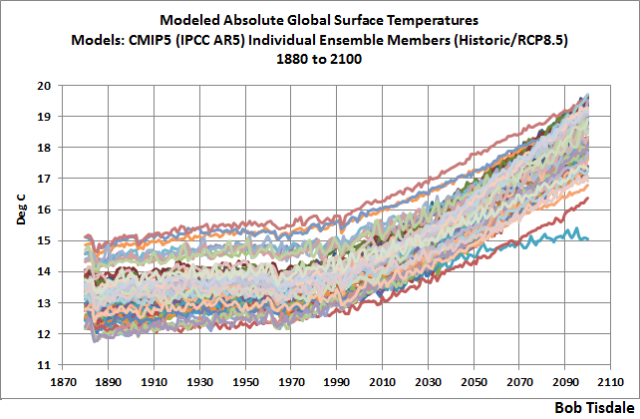
Figure 1
However, the spreadsheets I prepared for that post had the climate model hindcast outputs as far back as their common start year of 1861. (I say common start year of 1861 because the outputs of some models stored in the CMIP5 archive start in 1850 while others begin in 1861.) So I couldn’t use the climate model outputs stored on that spreadsheet for this post.
Note: The IPCC’s new definition of preindustrial, as stated in their Changes to the Underlying Scientific-Technical Assessment to ensure consistency with the approved Summary for Policymakers:
The reference period 1850-1900 is used to approximate pre-industrial global mean surface temperature (GMST).It’s odd that the IPCC selected those years when not all the climate models used in their 5th assessment report (those stored in the CMIP5 archive) for simulations of past and future climates extend back to 1850. Some only extended back to 1861. Then again, no one expects the IPCC to be logical because they’re a political, not scientific, entity.
Luckily, the ensemble members that meet the criteria of this post do extend back to 1850. So we’ll use the ensemble member outputs for the full IPCC-defined preindustrial period of 1850 to 1900 for this post.
ACCORDING TO THE CMIP5-ARCHIVED CLIMATE MODELS THERE’S A WIDE RANGE OF SIMULATED PREINDUSTRIAL GLOBAL MEAN SURFACE TEMPERATURES
The source of the outputs of the climate model simulations of global mean surface temperature used in this post is the KNMI Climate Explorer. Specifically, as a pre-qualifier, I used the outputs of the simulations of Surface Air Temperatures (TAS) from 90S-90N from the 81 individual ensemble members. From those, I identified the ensemble member with the warmest global mean surface temperature for the preindustrial period and the ensemble member with the coolest global mean surface temperature for the same period. For those who wish to confirm my results, the coolest (lowest average absolute GMST for the period of 1850-1900) is identified as IPSL-CM5A-LR EM-3 at the KNMI Climate Explorer, and the warmest (highest average absolute GMST for the period of 1850-1900) is identified there as GISS-E2-H p3. The average global mean surface temperatures for the other 79 ensemble members during preindustrial times rest between the averages of the two ensemble members.
The outputs of the simulations of global mean surface temperature from those two (the warmest and coolest absolute temperatures) ensemble members for the preindustrial period of 1850-1900 are illustrated in Figure 2, along with their respective period-average global mean surface temperatures for the IPCC-defined preindustrial period of 1850 to 1900 (dashed lines).
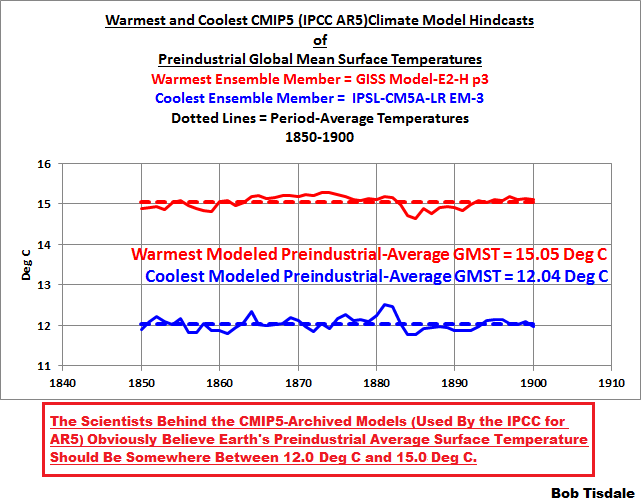
Figure 2
As noted at the bottom of the illustration, The Scientists Behind the CMIP5-Archived Models (Used By the IPCC for AR5) Obviously Believe Earth’s Preindustrial Average Surface Temperature Should Be Somewhere Between 12.0 Deg C and 15.0 Deg C. The modelers at the Goddard Institute for Space Studies (GISS) and at the Institut Pierre-Simon Laplace (IPSL) would NOT have archived those models if they hadn’t believed they were of value.
AND WHAT HAS BEEN THE AVERAGE GLOBAL MEAN SURFACE TEMPERATURE FOR THE PAST 30 YEARS?
On their data page here, for converting their anomaly data to absolute global means surface temperatures values, Berkeley Earth lists the factor (14.186 deg C) that is to be added to their annual global mean (land plus ocean, with air temperature over sea ice) surface temperature anomaly data. On the other hand, after discussing why it’s so difficult to determine the global mean surface temperature in absolute terms, GISS states on an FAQ webpage here:
For the global mean, the most trusted models produce a value of roughly 14°C, i.e. 57.2°F, but it may easily be anywhere between 56 and 58°F and regionally, let alone locally, the situation is even worse.[SEE THE UPDATE NEAR THE END OF THE POST.]
So, for the purpose of this very simple illustration and comparison, and for the discussions it will generate, I’ve added 14 deg C to the annual GISS LOTI data available here, and added 14.186 deg C to the annual Berkeley Earth data. I also compared them to the 12.04 deg C to 15.05 deg C range of hindcast preindustrial global mean surface temperatures from the climate model ensemble members discussed earlier. See Figure 3. Not too surprisingly, the Berkeley Earth and GISS global mean surface temperatures, in absolute form, are very similar, with only a 0.1 deg C difference during the most recent 30-years.
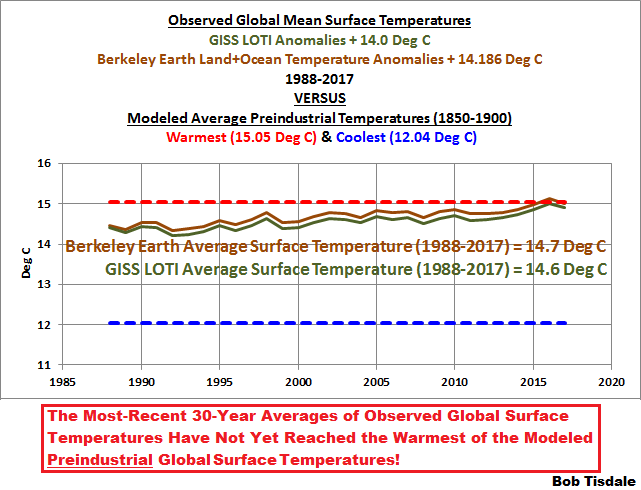
Figure 3
As is plainly visible and as noted at the bottom of the illustration, The Most-Recent 30-Year Averages of Observed Global Surface Temperatures Have Not Yet Reached the Warmest of the Modeled Preindustrial Global Temperatures!
In other words, based on 30-year climatological averages, recent global mean absolute surface temperatures have yet to reach the high end of the range of preindustrial global mean surface temperatures as hindcast by the climate models used by the IPCC for their 5th Assessment Report. It could, therefore, be argued that recent global mean surface temperatures are still within the realm of preindustrial natural variability, regardless of the 1 deg C that the Earth’s surfaces have risen since pre-industrial times.
If you look closely at Figure 3, you can see that the Berkeley Earth data recently peaked in 2016 at slightly above the highest of the simulated preindustrial average temperatures…with the 2014/15/16 El Niño-caused “record high” of 15.1 deg C. On the other hand, the GISS data peaked just below in 2016, at a “record high” of 15.0 deg C.
[sarc on.] Oh, heaven forbid! Based on the Berkeley Earth data, Earth’s global mean surface temperatures are now starting to run a teeny bit higher than the range of pre-industrial average temperatures. What are we to do, other than sit back and enjoy the vacation from cooler temperatures? [sarc off]
One might suspect that a simple comparison like this is one of the real reasons why the primary suppliers of global mean surface temperature data do not furnish their data in absolute form. Thank you, Berkeley Earth, for sparking my interest. We discussed another possible reason in the post Do Doomsters Know How Much Global Surface Temperatures Cycle Annually?
DEAR TROLLS, IF YOU LINK THE FOLLOWING WEBPAGE FROM REALCLIMATE TO SUPPORT YOUR ARGUMENT, SOME READERS WILL LAUGH AT YOU
In an apparent response to the 4-year-old post linked earlier (here) and to Willis Eschenbach’s post CMIP5 Model Temperature Results in Excel at WUWT that followed a month later, just after those two posts, in 2014, there was a discussion at RealClimate of modeled absolute global surface temperatures, authored by Gavin Schmidt, the head of the Goddard Institute of Space Studies (GISS). Gavin’s post is Absolute temperatures and relative anomalies. (Archived copy is here, just in case.)
The following are a couple of quotes from Gavin’s post. First (my boldface):
Second, the absolute value of the global mean temperature in a free-running coupled climate model is an emergent property of the simulation. It therefore has a spread of values across the multi-model ensemble. Showing the models’ anomalies then makes the coherence of the transient responses clearer. However, the variations in the averages of the model GMT values are quite wide, and indeed, are larger than the changes seen over the last century, and so whether this matters needs to be assessed.Needs to be assessed? A 3-deg C span in modeled global mean surface temperatures, which is “larger than the [1-deg C] changes seen over the last century”, hadn’t been assessed by 2014? Oy vey! As shown in the graph generated by the KNMI Climate Explorer in Figure 4, a similar 3-deg C spread in modeled absolute global surface temperatures existed in the models archived in CMIP3, which was used by the IPCC for their 4th Assessment Report published way back in 2007.
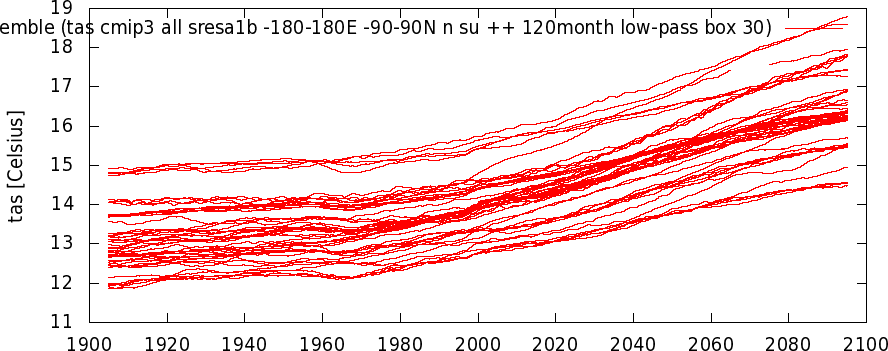
Figure 4
Note: For those questioning the coordinates listed in the above graph, the “-180-180E -90-90N” reads 180W to 180E, 90S to 90N. [End note.]
Second quote from Gavin’s post (my boldface):
Most scientific discussions implicitly assume that these differences aren’t important i.e. the changes in temperature are robust to errors in the base GMT value, which is true, and perhaps more importantly, are focussed on the change of temperature anyway, since that is what impacts will be tied to. To be clear, no particular absolute global temperature provides a risk to society, it is the change in temperature compared to what we’ve been used to that matters.Implicitly assume! I love that. Makes me laugh. Such is climate science.
And I really enjoy, “To be clear, no particular absolute global temperature provides a risk to society, it is the change in temperature compared to what we’ve been used to that matters.” Maybe the IPCC, the USGCRP and mainstream media should take that quote to heart. Hmmm, I feel a new post forming as I write this. I’ll most likely post it in a few days.
And if those two quotes look familiar, I presented them in the December 2014 post Interesting Post at RealClimate about Modeled Absolute Global Surface Temperatures (WattsUpWithThat cross post is here.)
As with all my model-data presentations, I suspect there will be complaints by the usual whiners.
That’s it for this post. Have fun in the comments and enjoy the rest of your day.
UPDATE REGARDING THE 14.0 DEG C ABSOLUTE TEMPERATURE FACTOR ADDED TO THE GISS ANOMALIES
There was no specific time period listed in the GISS FAQ link (here), or in the quote from it, presented earlier in the post, that I provided for the 14.0 deg C factor to be added to the GISS LOTI data to produce global temperatures in absolute form. (Thanks, blogger Dee at WUWT.) The 14.0 deg C factor used to be (past tense) listed at the bottom of the GISS LOTI data page and they were referenced to the period GISS uses for anomalies, 1951-1980. But the 14.0 deg C (57.2 deg F) factor is no longer listed on that GISS data page. GISS removed it for some reason. But archived versions of that webpage still exist (example here). There you’ll find:
Best estimate for absolute global mean for 1951-1980 is 14.0 deg-C or 57.2 deg-F, so add that to the temperature change if you want to use an absolute scale (this note applies to global annual means only, J-D and D-N !)[End Update.]

No comments:
Post a Comment