Electricity Generation Costs for New Generating Technologies
The Energy
Information Administration produces forecasts of energy supply &
demand using the National Energy Modeling System (NEMS). All sectors of
the energy system are represented in NEMS, including the electric power
generation, transmission, & distribution system.
The Energy Information Administration (EIA) produces forecasts of energy supply and demand for the next 20 years using the National Energy Modeling System (NEMS)[1]. These forecasts are updated annually and published in the Annual Energy Outlook (AEO).[2] All sectors of the energy system are represented in NEMS, including the electric power generation, transmission, and distribution system.
In the NEMS model, the EIA represents existing generating plants, retires those that have come to the end of their economic life, and builds additional plants to meet projected demand from the residential, commercial, industrial, and transportation sectors. As a result, EIA must represent a slate of technologies, their capital and operating costs, their availability and capacity factors, the financial structure and subsidies, the time to construct the plant, the utilization of the plant, and expected future cost changes, including fuel input for fossil and nuclear plants.
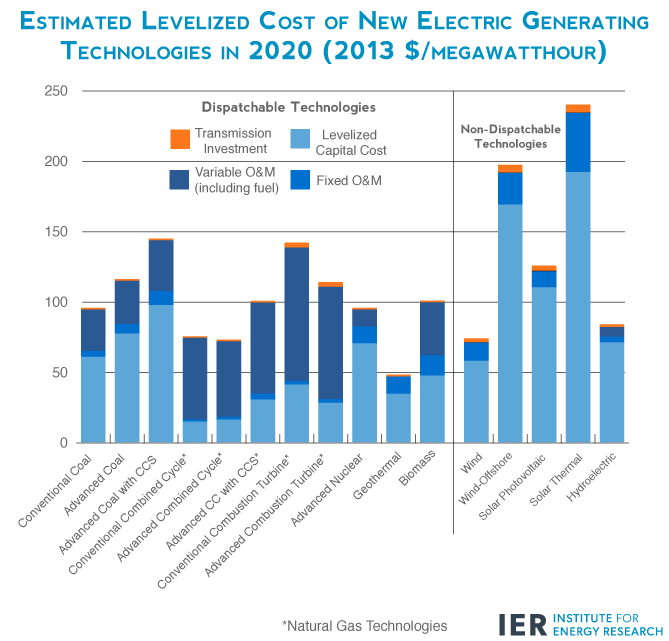
To determine the most economic technology for the type of demand (base, intermediate, or peaking load) for which new capacity is needed, NEMS compares the technologies using their levelized costs as one measure of competitiveness. Levelized costs represent the present value of the total cost of building and operating a generating plant over its financial life, converted to equal annual payments and amortized over expected annual generation from an assumed duty cycle.
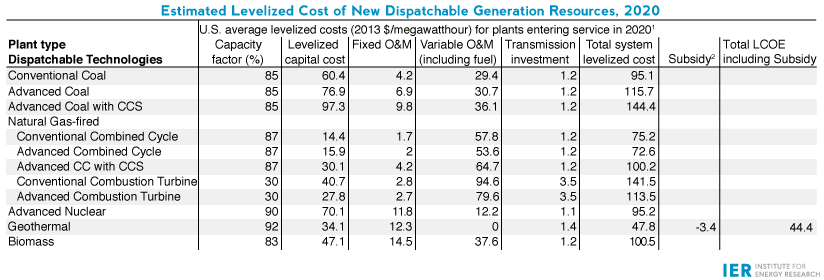
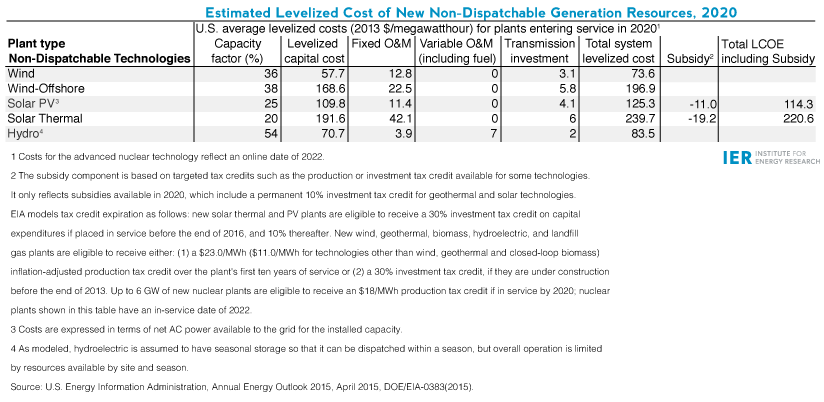
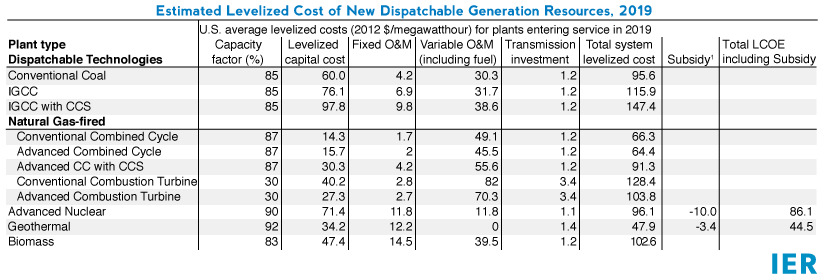
The first table below provides the average national levelized costs for the generating technologies represented in the AEO2015 reference case.[3] The values shown in the table are given with and without the federal financial incentives, which impact the cost and the competitiveness of the technology. These incentives are incorporated in the evaluation of the technologies in NEMS based on current laws and regulations in effect at the time of the modeling exercise, as well as regional differences in the cost and performance of the technology, such as labor rates and availability of wind or sun resources.
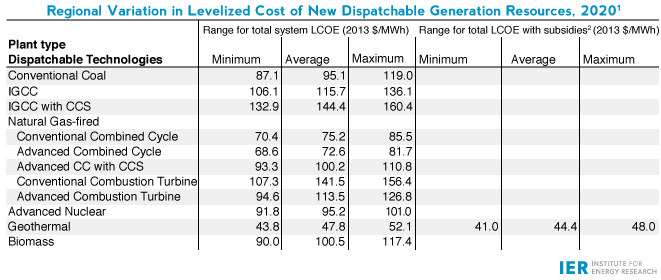
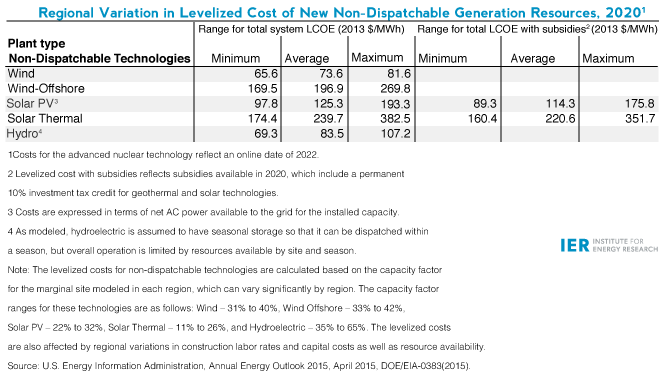
Due to the regional differences in the cost of labor, fuel, and other factors that affect the levelized generation cost, a second table is provided below that gives the range of levelized costs based on these differences. The levelized cost for each generation technology are calculated based on a 30-year cost recovery period, using a real after tax weighted average cost of capital of 6.1 percent.[4] In the AEO2015 reference case, EIA adds a 3-percentage point increase in the cost of capital when evaluating investments in greenhouse gas intensive technologies such as coal-fired power plants without carbon capture and sequestration (CCS) technology and coal-to-liquids plants. The 3-percentage point adjustment is similar to a $15 per ton carbon dioxide emissions fee when investing in a new coal plant without CCS technology. This adjustment represents the implicit hurdle being added to greenhouse gas intensive projects to account for the possibility that they may need to purchase allowances or invest in other greenhouse gas emission-reducing projects that offset their emissions in the future. Thus, the levelized capital costs of coal-fired plants without CCS are likely higher than most current coal project costs.
The levelized cost for each technology is evaluated based on the capacity factor indicated, which generally corresponds to the maximum availability of each technology. However, some technologies, such as a conventional combined cycle turbine, that may look relatively expensive at its maximum capacity factor may be the most economic option when evaluated at a lower capacity factor associated with an intermediate load rather than base load facility.[5] Simple combustion turbines (conventional or advanced technology) are typically used for peak load, and are thus evaluated at a 30 percent capacity factor.
Intermittent renewable resources, e.g. wind and solar, are not operator controlled, but dependent on the weather or the sun shining. Since the availability of wind or solar is dependent on forces outside of the operator’s control, their levelized costs are not directly comparable to those for other technologies although the average annual capacity factor may be similar. The capacity factors shown for solar, wind, and hydroelectric resources are simple averages of the capacity factor for the marginal site in each region. These capacity factors can vary significantly by region and can represent resources that may or may not get built in EIA capacity projections. Projected capacity factors for these resources in the AEO 2015 or other EIA analyses will not necessarily correspond to these levels. Because intermittent technologies do not provide the same contribution to system reliability as technologies that are operator controlled and dispatched, they may require additional system investment as back-up power that are not included in the levelized costs shown below.
EIA warns against the direct comparison of the levelized costs across technologies as the sole measure of economic competitiveness because of differences in resource mix, capacity values, and utilization rates across regions. Rather, the agency suggests that the levelized avoided cost, which measures the cost to the grid to generate the electricity that is being displaced by the new generation project, also be used in elevating market penetration of a particular technology. According to EIA, “The economic decisions regarding capacity additions in EIA’s long-term projections reflect these concepts rather than simple comparisons of levelized project costs across technologies.” Please refer to EIA’s discussion on the levelized avoided cost at http://www.eia.gov/forecasts/aeo/electricity_generation.cfm.
Source: Energy Information Administration, Annual Energy Outlook 2014, http://www.eia.gov/forecasts/aeo/er/electricity_generation.cfm
[1] Energy Information Administration, NEMS documentation, http://www.eia.doe.gov/oiaf/aeo/overview/index.html
[2] Energy Information Administration, Annual Energy Outlook 2015, http://www.eia.doe.gov/oiaf/aeo/index.html
[3] Energy Information Administration, Annual Energy Outlook 2015, http://www.eia.gov/forecasts/aeo/electricity_generation.cfm
[4] The real weighted average cost of capital (WACC) for plants entering service in 2020 is 6.1 percent; nuclear plants are assumed to enter service in 2022 and have a real WACC of 6.2 percent. The real WACC corresponds to a nominal after tax rate of 8.1 percent for both plants entering service in 2020 and 2022. An overview of the WACC assumptions and methodology can be found in the Electricity Market Module of the National Energy Modeling System: Model Documentation, which can be found at http://www.eia.gov/forecasts/aeo/nems/documentation/electricity/pdf/m068(2014).pdf.
[5] Base load plants are facilities that operate almost continuously, generally at annual utilization rates of 70 percent or higher. Intermediate load plants are facilities that operate less frequently than base load plants, generally at annual utilization rates between 25 and 70 percent. Peaking plants are facilities that only run when the demand for electricity is very high, generally at annual utilization rates less than 25 percent.

No comments:
Post a Comment