Tilting at Windmills: a Geologist’s View of the Monticello Wind Farm…by Gene Stevenson
by stiles • • 3 Comments
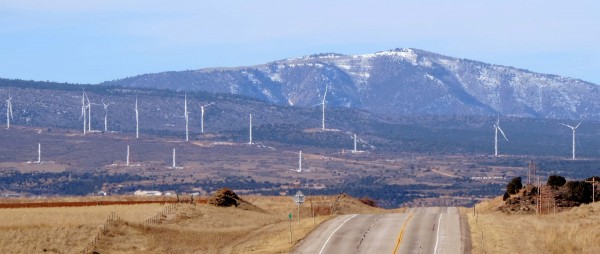
Monticello Wind Farm. photo by Jim Stiles.
Ever since the “green energy movement” has really caught on, claims have been made that we should radically change our energy (power) diet, and do so immediately. We’ve been told to abandon our existing systems based on fossil fuels for something new and clean and renewable that doesn’t ruin the environment; something that is low-carbon, solar-powered, wind-powered, or better yet, powered by the singlemost desired element: unobtainium!
We are told we need to make this transition as quickly as possible so that the United States will become “energy independent” and not have to get involved in Middle East wars and we might begin to turn the tide on terrorism by not spending huge sums of money on a dying resource like hydrocarbons. In fact, using hydrocarbons is just down right being “foolish” says the Sierra Club and their ilk because of all the perceived dangerous effects of global warming or climate change brought about by burning coal, oil and natural gas that releases ungodly amounts of CO2 into our fragile atmosphere.
The global energy business is about $5-trillion-per-year that dwarfs all other sectors of the economy. But before we just jump off the proverbial energy-grid, we need to evaluate the various energy sources to determine which ones can satisfy the four basic imperatives: power density, energy density, cost and scale. By using and understanding these metrics we can begin to confront some brutal facts and winnow out the pretenders. We need to look first at the underlying causes of America’s energy unease: guilt, fear, and our gullibility are key factors, but the most important factor is ignorance.
Most folks simply don’t know or care how energy and power are produced and that lack of knowledge, combined with widespread scientific illiteracy and innumeracy makes for a deadly combination. Therefore, my computations are provided below in a “table or worksheet” format showing how I derived the numbers presented in this essay. I can assure you that these calculations are straightforward and can be verified through the several sources listed.
Scientific Literacy
Various scientific literacy studies are conducted almost every year by several major American universities (e.g. Michigan State, Harvard, California Academy of Sciences) that release their findings of a survey which found that most Americans couldn’t pass, such as:
- 53% of adults know how long it takes for the Earth to revolve around the Sun;
- 59% knew that the earliest humans did not live at the same time as dinosaurs;
- 47% of adults could provide a rough estimate of the proportion of the Earth’s surface that is covered with water [the academy accepted any number within the range of 65% to 75%]
- 46% of adults knew that electrons are smaller than atoms
- 78% of adults could not explain how to compute the interest paid on a loan
- 71% could not calculate miles per gallon on a trip
- 58% were unable to calculate a 10% tip for a restaurant bill
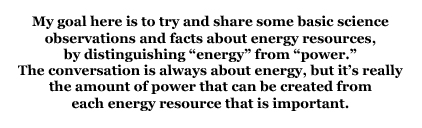
A Latigo Wind Farm turbine pad, pre-installation. Photo by Jim Stiles
We use several sources of energy. Understanding how they compare to each other in terms of power, or energy output, can be a thorny problem because each is measured and sold in a mind-numbing variety of units. For instance, oil is measured and sold in barrels, tons and gallons while natural gas is measured and sold in cubic meters, millions of Btu and cubic feet. Electricity is sold in kilowatt-hours, but electricity terminologies deal in other units too, like volts, amperes and ohms; and then add in joules, watts, ergs and calories and things really become mind-boggling. Most manufactured components requiring metals and REE’s are measured in tons or pounds while concrete is measured by cubic meters or cubic yards and water by gallons, cubic feet per second or acre feet.
To sort this out, let’s first start with the electricity that will be produced by the wind farm. When fully
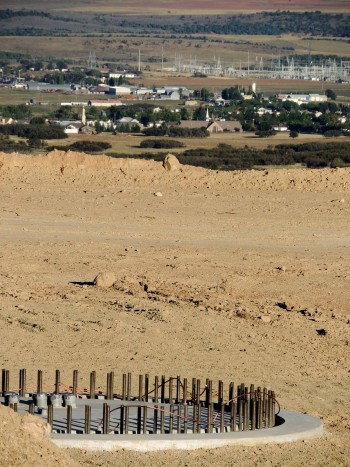
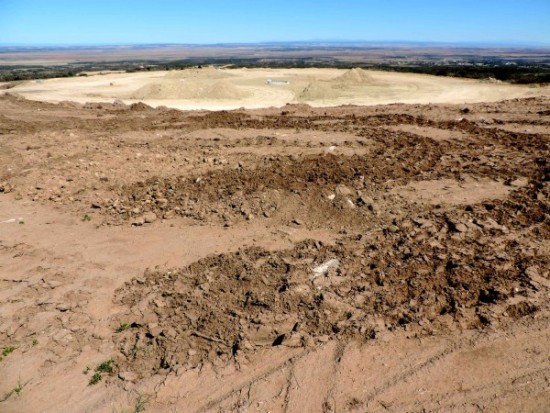
View down on Monticello from a Latigo wind turbine pad, before turbine installation. photo by Jim Stiles
Next let’s look at oil. A standard 42 gallon barrel of oil (BO) is equivalent to 1.7 MW, thus the capacity factor is equivalent to 36.53 BO. According to sPower’s representative these turbines actually are factored to operate at 30% of the capacity, or 18.63 MW which equals 10.96 BO. In a perfect world with perfect wind conditions the Latigo Wind Farm could possibly generate 62.1 MW per hour or 1490.4 MW per 24 hours. That amounts to 876.72 BO per day, but at the more realistic 30% rate the wind farm could generate 447.12 MW or the equivalent of 263.04 BOPD.
Now, a well producing 263 BOPD is a nice little well, and many wells drilled in the Paradox basin that are completed as “producers” equal or exceed this initial production amount. BUT, a well worthy of offsetting must exceed 263 BOPD to be considered “economically feasible”. That means if they don’t produce at least this amount, then there is a slim chance of more wells being drilled. Stated in a different way, if the maximum output of a well only producing 263 BOPD could have been known at the outset, it would probably have never been budgeted to be drilled.
Values of the wind turbine height and rotor blade lengths have varied in the two newspapers, but suffice to say – they are BIG! And all these components, including two very large transformers, have arrived via diesel-powered trucks on asphalt-paved highways. County roads have been widened and electric power lines and substations are being built to handle this extra load of electricity. Each tower requires 400 cubic yards of reinforced concrete for each pedestal. And I’m almost dead certain that many acres of precious cryptogamic soil have been destroyed. Yet, sPower states “it is domestic production of power, it is entirely renewable resource, and no fuel is consumed.” I think that this comment deserves a bit more scrutiny.
When the following facts are added to the equation about the additional energy resources required to build the wind farm in the first place, one begins to wonder about the economic wisdom of such a facility if it wasn’t subsidized.
Take for example concrete: the 27 turbine pedestals x 400 yd3 concrete = 20,850 tons of sand, gravel, cement and water, of which 346,000 gallons of water is needed [No figure for rebar other than “tons” needed]. Then there’s the miscellaneous items like fuel (lots of fuel) for construction & transporting transformers and all the turbines and fans, tires, lead, copper, aluminum and iron and alloys for steel – all acquired by mining & drilling with fossil fuels – the much maligned “extractive industries!” Plus, the wind farm will occupy a 3,600 acre footprint while a 263 BOPD oil well would have a 40 acre spacing, of which the actual footprint of the drill location would be less than one (1) acre [so much for the much touted environmentalists argument for “visual resource management!”]. See accompanying photo of drilling well near Lisbon Valley.
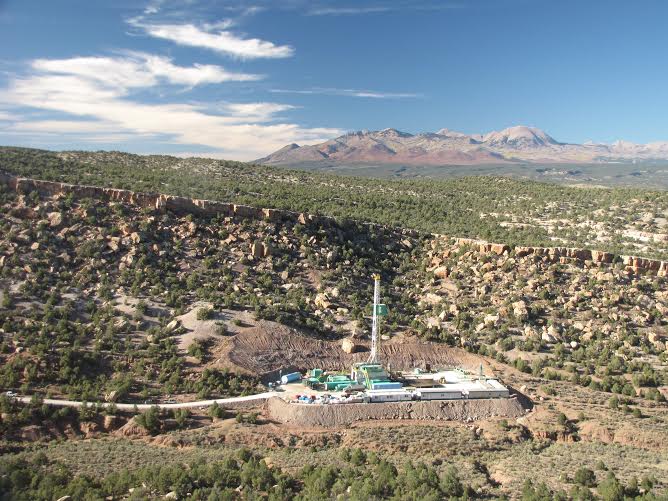
Photo
of a drill rig that discovered more oil and gas than the equivalent of
two or more Latigo Wind Farms (imagine 60 or more wind turbines in this
view, rather than that one oil well). GMS photo
Up
until the 1990s, San Juan County led the State of Utah in the
production of natural resources such that taxes derived allowed the
county to build an infrastructure of high quality roads and maintain a
relatively low property tax base for its residents. As further
development of these resources have been thwarted by an ever increasing
movement to control public land use the roadblocks to accessing natural
resources have increased. Alternative “green” energy policies have been
enacted during this period to replace what is perceived to be
detrimental energy resources. But as shown above, these new alternatives
provide substantially less “bang for the buck” and will end up
requiring immensely bigger swaths of land to equal the energy provided
by fossil fuels.
And
to show that this misdirected policy is now entrenched into America,
look no further than what our Congress just did by extending tax breaks
and subsidies for so-called “renewable” energy until at least 2022 in
the trillion dollar budget deal President Obama signed at the end of the
year (2015).The hype about wind and solar does not stand up to the facts. Wind and solar routinely produce less energy than promised. Want proof? In 2014, the United States generated about 4,093 billion kilowatt-hours of electricity. About 67% of the electricity generated was from fossil fuels (coal, natural gas, and petroleum). See www.eia.gov/tools/faq . Here’s the major energy sources and percent share of total U.S. electricity generation in 2014 (latest date available):
- Coal = 39%
- Natural Gas = 27%
- Nuclear = 19%
- Hydropower = 6%
- Other “renewables” = 7%
- Biomass = 1.7%
- Geothermal = 0.4%
- Solar = 0.4%
- Wind = 4.4%
- Petroleum = 1%
- Other gases = < 1%
And to prove this point, look no further than billionaire Warren Buffett who would do anything to lower the tax rate of his company Berkshire Hathaway, including building unprofitable wind turbines to get federal government tax credits.
“I will do anything that is basically covered by the law to reduce Berkshire’s tax rate,” Buffett told an audience in Omaha, Nebraska last year. “For example, on wind energy, we get a tax credit if we build a lot of wind farms. That’s the only reason to build them. They don’t make sense without the tax credit.”
Or take a look at what Marita Noon reports about SolarCity at CFACT.org. SolarCity installs a third of the solar panels on America’s rooftops. They have made it plain that they are only interested in installing panels if government covers the bill. When government doesn’t pay, they won’t play.
Politically correct energy cannot power our future.
It’s time for wind and solar to freely and fairly compete in the marketplace.
Thus, the landscape of southeastern Utah has changed and will be changing to a sea of windmills, and all in the name of keeping a pretty darn clean if not a pristine environment clean. And property and other types of taxes will continue to grow to make up the difference.
Blow baby blow!
CONVERSION TABLE RELATED TO LATIGO WIND FARM
WATER: 1 cubic foot = (12″ x 12″ x 12″) = 1,728 cubic inches
1 gallon = 231 cubic inches
1728/231 = 7.48052 gallons per cubic foot
Water is heavy; it weighs about 8.4 pounds per gallon (8.4 ppg), so one cubic foot of water (7.48 gallons) weighs almost 63 pounds (62.832 lbs)
1 cubic foot per second (1 cfs) = 7.48052 gallons per second
1 acre = 43,560 ft2 or 208.71 ft per side
1 mile = 5,280 ft
640 acres per mi2 = 5280 ft x 5280 ft = 27,878,400 ft divided by 640 ac = 43,560 ft2
1 acre foot of water means to take an acre in square feet (43,560) times a cubic foot of water (7.48052 gallons) to get the number of gallons per acre foot, or
43,560 x 7.48052 = 325,851.45 US gallons/acre (rounded off typically to 326,000 gal per acre)
ELECTRICITY:
1 MW (megawatt) of electricity = 1341 horsepower (hp)
1 MW = 1000 kw, or 1×10⁶ watts
Thus, 62.1 MW = 83,277 hp or 0.0621 GW (gigawatts); therefore = 6.21 x 10⁷ W (watts)
ELECTRICITY TO OIL:
Converting electricity to oil terms is a straightforward calculation. One barrel of oil (BO) contains 42 U.S. gallons per barrel (US liquid) and contains the energy equivalent of 1.7 megawatt-hours of electricity.
1 BOE (bbls of oil equivalent) to Btu = 5.79 x 10⁶ Btu, or a BO contains approximately 5.8 million Btu
58 thm (therms)
6.11 GJ (gigajoules)
6.11 x 10⁹ J (joules)
6.11 x 10¹⁶ ergs
1.7 MWh (megawatt hours)
CONCRETE:
Convert cubic yards to cubic meters
1 yd3 = 0.7646 m3 = 27 ft3 [3 ft x 3 ft x 3 ft = 27 cubic feet]
400 yd3 = 305.8 m3 = 10,800 ft3
27 x 400 = 10,800 yd3 = 8257 m3 = 291,600 ft3
1 pound (lb) = 16 oz = 0.4536 kg
Basic “recipe” for concrete:
1 part Portland + 2 part dry sand + 3 part aggregate + 0.5 part water by weight, not volume:
Water: 1 kg water = 0.2642 gallons using water density = 1000 kg/m3
1 gal wtr = 3.785 kg = 8.345 lbs [I use 8.4 lbs to include total dissolved solids in water]
1 ft3 of concrete = 0.028 m3 would weigh about 143 lbs (65 kg)
1 yd3 of concrete = 27 ft3 = 3861 lbs (1755 kg)
22 lbs (10.0 kg) cement x 27 = 594 lbs (270 kg)
10 lbs (4.5 kg) water x 27 = 270 lbs (121.5 kg) = 1.1889 gallons of water x 27 = 32.1004 gal
41 lbs (19 kg) sand x 27 = 1107 lbs (513 kg)
70 lbs (32 kg) aggregate x27 = 1890 lbs (864 kg); thus
1 yd3 of concrete = 3861 lbs or (1768.5 kg) of which there is ~32 gallons water per cubic yard
400 yd3 = 1,544,400 lbs or (707,400 kg) per pad; divided by 2,000 lbs (1 ton) = 772.2 tons
Of which 400 x 32 = 12,800 gallons of water per pad
27 wind mill pads = 41,698,800 lbs or (19,099,800 kg) = 20,849.4 tons
12,800 gal x 27 = 345,600 gal water to make concrete for the pads
And one acre foot of water = 325,851.45 US gallons, so pads used about 1.061 ac ft of water
Notes on “type” of concrete:
Regular concrete is the lay term for concrete that is produced by following the mixing instructions that are commonly published on packets of cement, typically using sand or other common material as the aggregate, and often mixed in improvised containers. The ingredients in any particular mix depend on the nature of the application. Regular concrete can typically withstand a pressure from about 10 MPa (1450 psi) to 40 MPa (5800 psi), with lighter duty uses such as blinding concrete having a much lower MPa rating than structural concrete. Many types of pre-mixed concrete are available which include powdered cement mixed with aggregate, needing only water.
High-strength concrete has a compressive strength greater than 40 MPa (5800 psi). High-strength concrete is made by lowering the water-cement (*W/C) ratio to 0.35 or lower. Often an ultrafine powder of non-crystalline micro-silica (silica fume) is added to prevent the formation of free calcium hydroxide crystals in the cement matrix, which might reduce the strength at the cement-aggregate bond.
*Low W/C ratios and the use of silica fume make concrete mixes significantly less workable, which is particularly likely to be a problem in high-strength concrete applications where dense rebar cages are likely to be used; therefore, my calculations may be skewed one way or other as details regarding cement strengths were not ascertained in this report
Sources: Energy Information Administration, “Energy Calculators”
http://windeis.anl.gov/guide/basics/
http://www.wolframalpha.com/ (computations)
Mr. Stevenson has 43 years’ experience
in applied geology. His main area of expertise lies in furthering the
understanding of the geologic history of the Colorado Plateau, with
particular emphasis on the Paleozoic geologic history of the Paradox
basin and greater Four Corners region of the Colorado Plateau. He has
authored or coauthored 47 geological papers and abstracts and has
conducted numerous geological field trips and proprietary seminars. His
specialties include carbonate petrography, subsurface stratigraphy,
ancient depositional systems, and associated structure and tectonics.
He has also been running rivers for about 45 years, mainly within
the Colorado River system. he has lived in Bluff, Utah since 1991.
No comments:
Post a Comment