CU Sea Level Fraud
I live in the epicenter of climate fraud, surrounded by NCAR, NOAA, NSIDC and the University of Colorado – who showed in 2004 that sea level was rising 2.8 mm/year.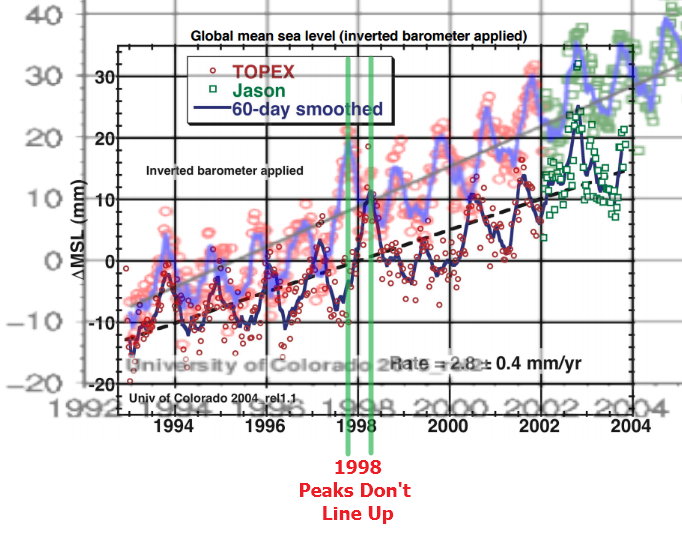
By 2015, they had bumped that up to 3.3 mm/year, even though their graph showed sea level rise had slowed after 2004.
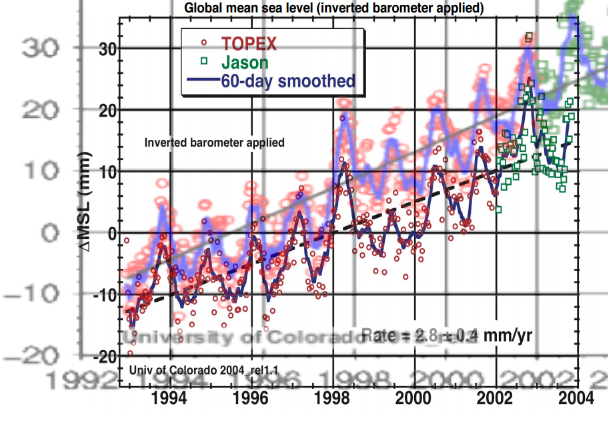
I overlaid the two graphs at the same scale
below, and you can see several interesting smoking guns. The first is
obvious – they simply increased the rate of sea level rise from 1993 to
2004 . But the more interesting one is that the peaks no longer line up.
In the earlier version, the 1998 peak came in 1998. Now it comes in
1997. This tells us that they are either completely incompetent or are
simply making stuff up.
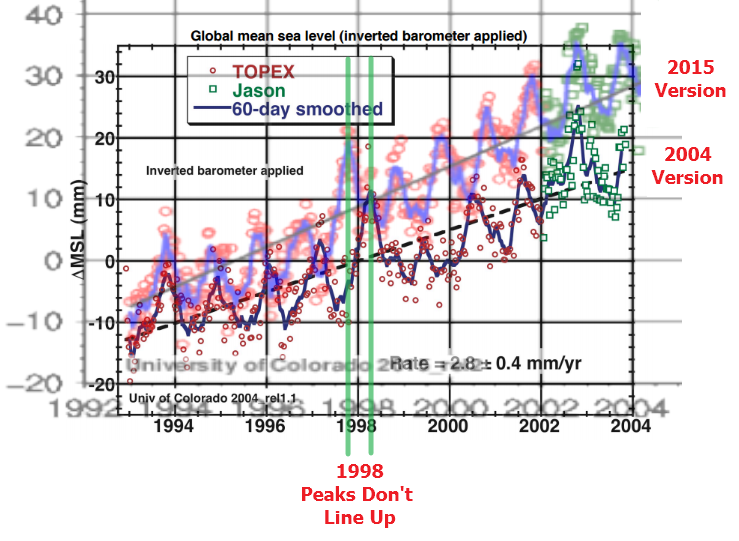
I can make the peaks line up by
expanding the X-axis of the 2015 graph, but then the years don’t line up
and the Jason data starts a year later in the 2015 graph than it does
in the 2004 graph. It is apparent that these people are simply making
data up as they go along, and not being very careful about it.
CU satellite data reports almost double the rate of sea level rise as NOAA tide gauges, and orbital decay would be a likely culprit for the discrepancy. But they won’t fix it, because it would hurt their funding if the did.
Adjustments are made to increase funding, not increase accuracy.the absolute global sea level rise is believed to be 1.7-1.8 millimeters/year.
Sea Level Trends – Global Regional Trends


No comments:
Post a Comment