CO2 Not Dangerous

Figure 1 depicts EPA’s endangerment chain of reasoning.
The first supplement (here) addressed the first part of the scientific case, namely that fossil fuel emissions cause warming in earth’s atmosphere. The rebuttal consists of three points:
First, Research Reports failed to find that the steadily rising atmospheric CO2 concentrations have had a statistically significant impact on any of the 14 temperature data sets that were analyzed. The tropospheric and surface temperature data measurements that were analyzed were taken by many different entities using balloons, satellites, buoys and various land based techniques.
Report this ad
Second, new information is submitted regarding the logically invalid use of climate models in the attribution of warming to human greenhouse gas (GHG) emissions.Third, new information is submitted relevant to the invalidation of the “Tropical Hot Spot” and the resulting implications for the three lines of evidence, a subject that was also discussed in our original Petition.
Now we have a Fifth Supplement (here) which rebuts in detail the “lines of evidence” which claim to prove man-made global warming is causing observable changes in nature.
Report this ad
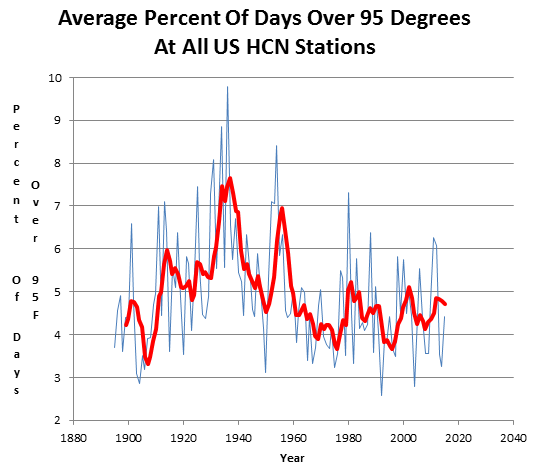
Claim #1: Heat Waves are increasing at an alarming rate and heat killsSummary of Rebuttal There has been no detectable long-term increase in heat waves in the United States or elsewhere in the world. Most all-time record highs here in the U.S. happened many years ago, long before mankind was using much fossil fuel. Thirty-eight states set their all-time record highs before 1960 (23 in the 1930s!). Here in the United States, the number of 100F, 95F and 90F days per year has been steadily declining since the 1930s. The Environmental Protection Agency Heat Wave Index confirms the 1930s as the hottest decade.
Claim #2: Global warming is causing more hurricanes and stronger hurricanes
Summary of Rebuttal: There has been no detectable long-term trend in the number and intensity of hurricane activity globally. The activity does vary year to year and over multidecadal periods as ocean cycles including El Nino/La Nina,multidecadal cycles in the Pacific (PDO) and Atlantic (AMO) favor some basins over others. The trend in landfalling storms in the United States has been flat to down since the 1850s. Before the active hurricane season in the United States in 2017, there had been a lull of 4324 days (almost 12 years) in major hurricane landfalls, the longest lull since the 1860s.

Claim #3: Global warming is causing more and stronger tornadoes
Summary of Rebuttal Tornadoes are failing to follow “global warming” predictions. Big tornadoes have seen a decline in frequency since the 1950s. The years 2012, 2013, 2014, 2015 and 2016 all saw below average to near record low tornado counts in the U.S. since records began in 1954. 2017 to date has rebounded only to the long-term mean. This lull followed a very active and deadly strong La Nina of 2010/11, which like the strong La Nina of 1973/74 produced record setting and very deadly outbreaks of tornadoes. Population growth and expansion outside urban areas have exposed more people to the tornadoes that once roamed through open fields.

Claim #4: Global warming is increasing the magnitude and frequency of droughts and floods.
Summary of Rebuttal Our use of fossil fuels to power our civilization is not causing droughts or floods. NOAA found there is no evidence that floods and droughts are increasing because of climate change. The number, extend or severity of these events does increase dramatically for a brief period of years at some locations from time to time but then conditions return to more normal. This is simply the long-established constant variation of weather resulting from a confluence of natural factors.

Claim #5: Global Warming has increased U.S. Wildfires
Summary of Rebuttal Wildfires are in the news almost every late summer and fall. The National Interagency Fire Center has recorded the number of fires and acreage affected since 1985. This data show the number of fires trending down slightly, though the acreage burned had increased before leveling off over the last 20 years. The NWS tracks the number of days where conditions are conducive to wildfires when they issue red-flag warnings. It is little changed.

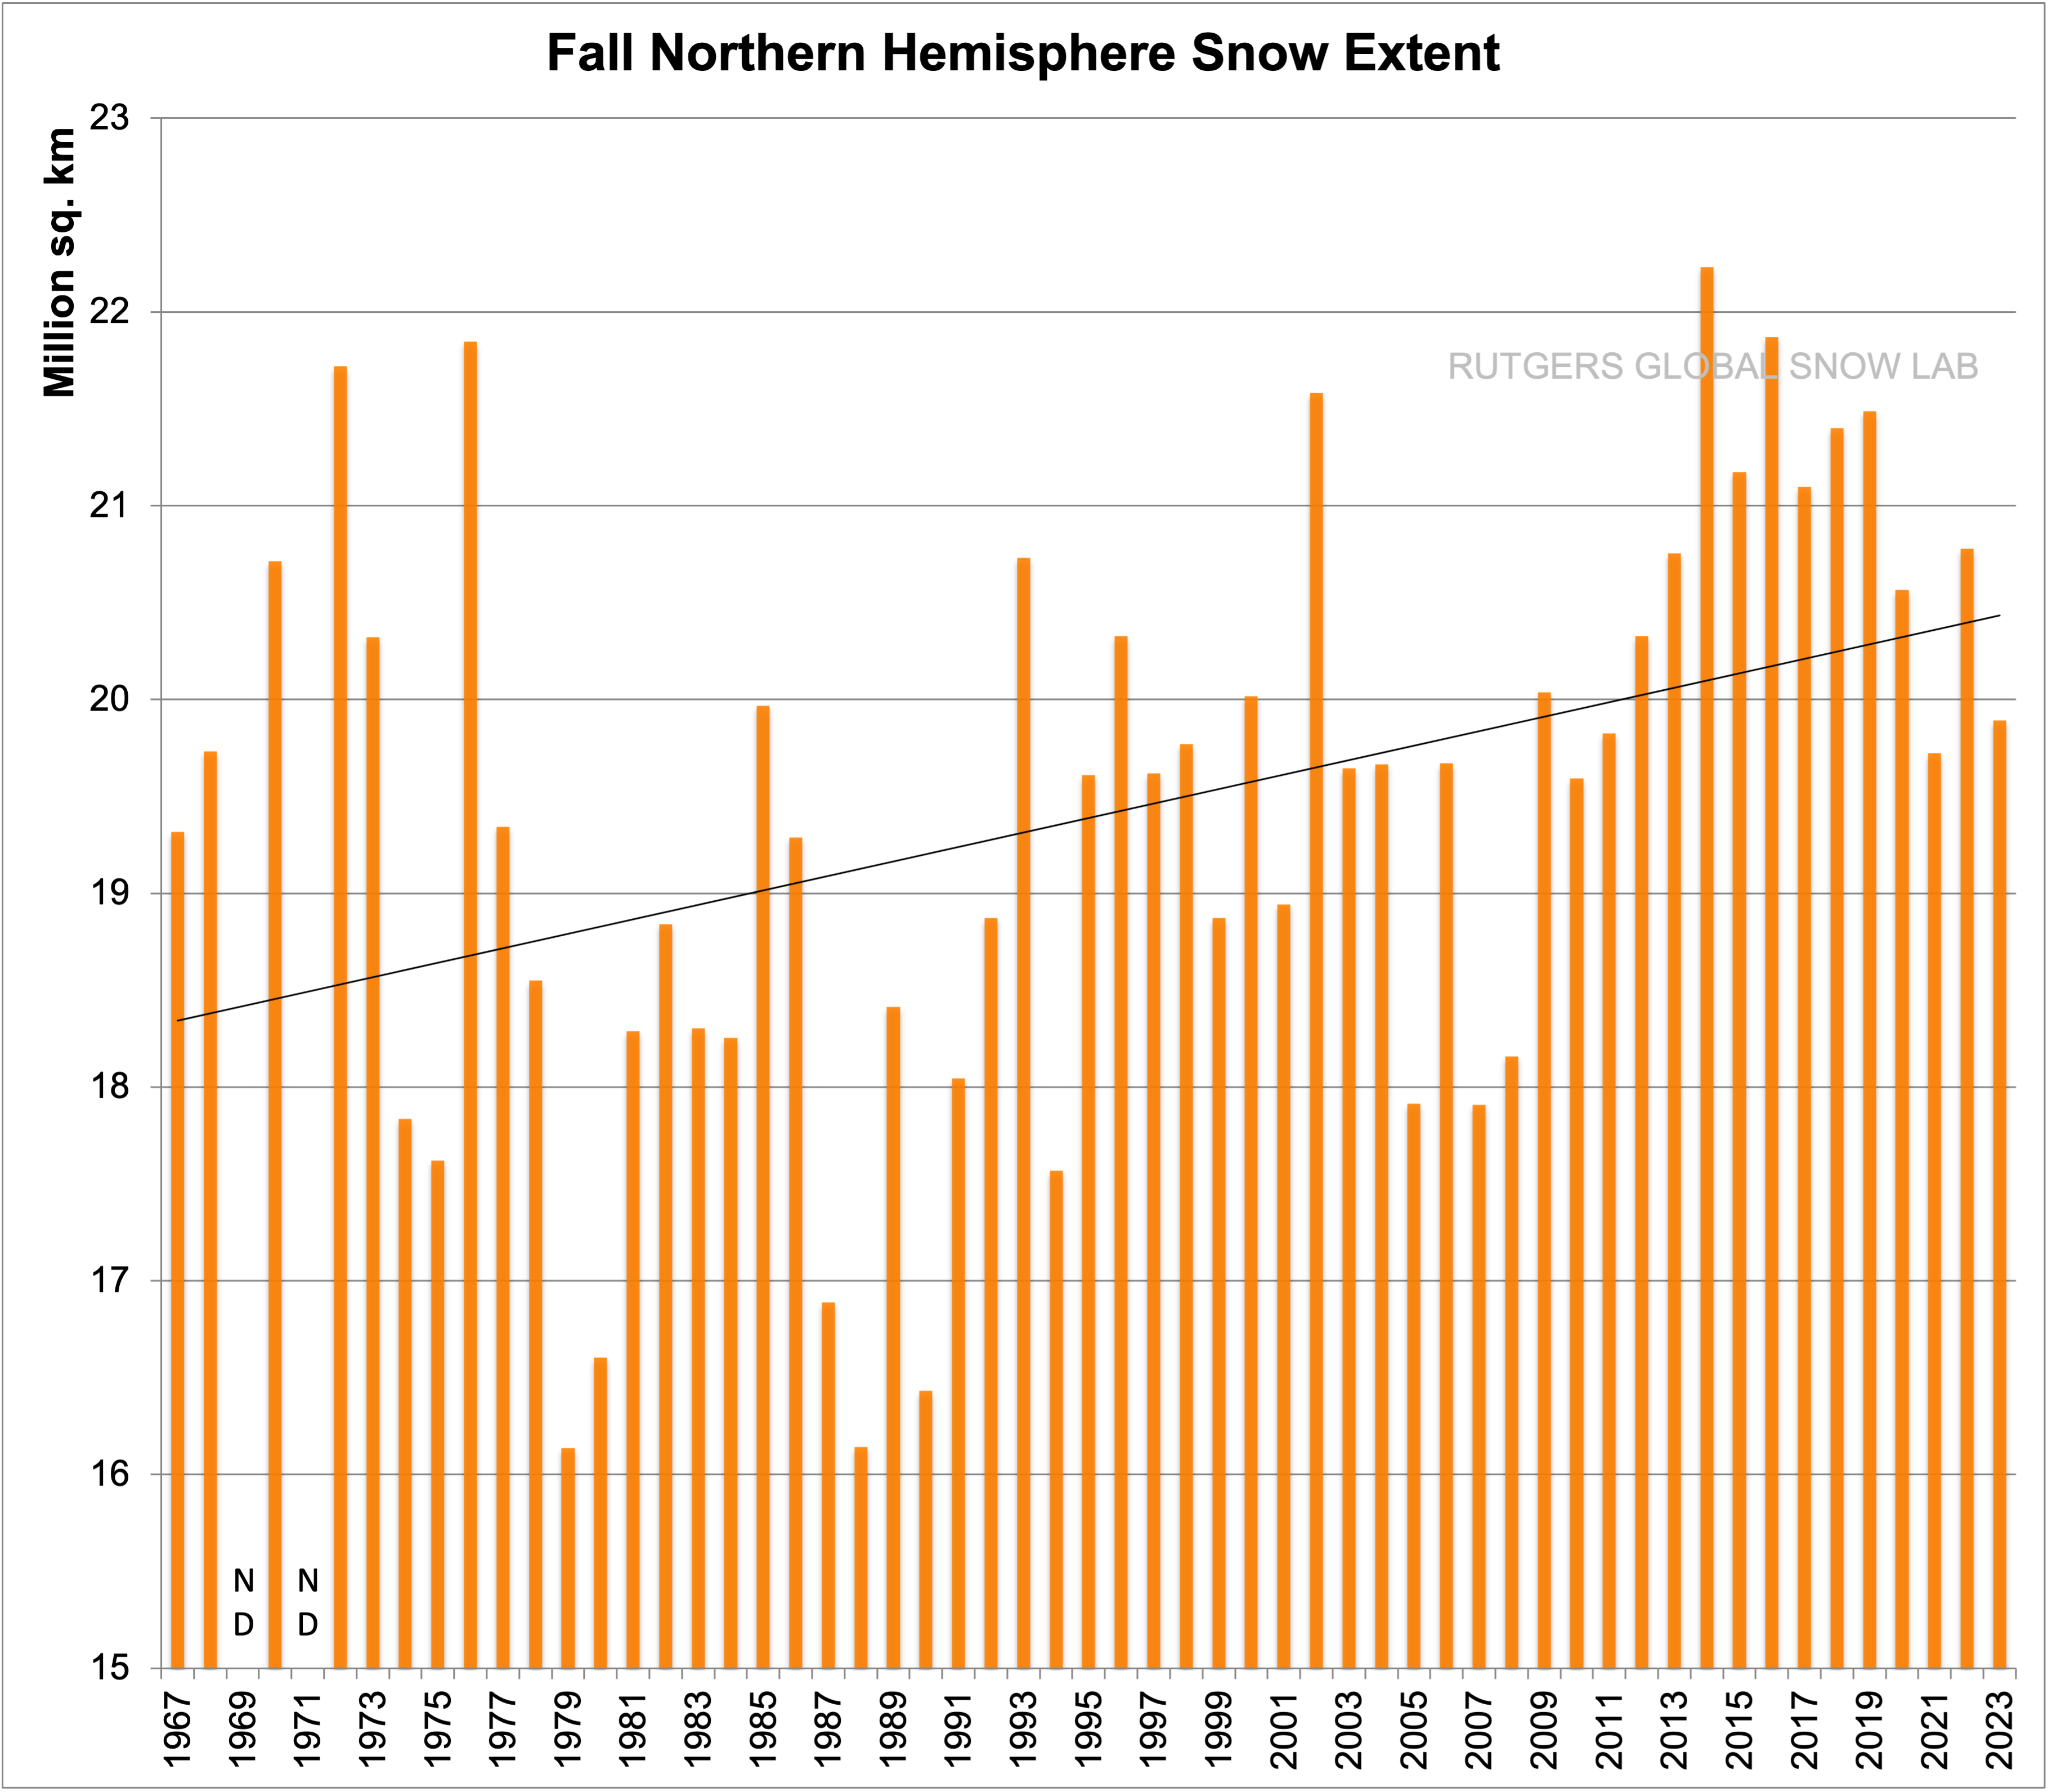
Claim #6: Global warming is causing snow to disappear
Summary of Rebuttal This is one claim that has been repeated for decades even as nature showed very much the opposite trend with unprecedented snows even to the big coastal cities. Every time they repeated the claim, it seems nature upped the ante more. Alarmists have eventually evolved to crediting warming with producing greater snowfall, because of increased moisture but the snow events in recent years have usually occurred in colder winters with high snow water equivalent ratios in frigid arctic air.
Claim #7: Global warming is resulting in rising sea levels as seen in both tide gauge and satellite technology.
Summary of Rebuttal This claim is demonstrably false. It really hinges on this statement: “Tide gauges and satellites agree with the model projections.” The models project a rapid acceleration of sea level rise over the next 30 to 70 years. However, while the models may project acceleration, the tide gauges clearly do not. All data from tide gauges in areas where land is not rising or sinking show instead a steady linear and unchanging sea level rate of rise from 4 up to 6 inches/century, with variations due to gravitational factors.

Figure 1. Modelled and observed sea-level changes, 1840-2010. The curve marked “Models” represents the IPCC’s combination of selected tide-gauge records and corrected satellite altimetry data. The curve marked “Observations” represents the observed eustatic sea level changes in the field up to 1960 according to Mörner (1973) and (in this paper) thereafter. After 1965, the two curves start to diverge, presenting two totally different views, separated by the area with the question mark. Which of these views is tenable?
Claim #8: Arctic, Antarctic and Greenland ice loss is accelerating due to global warming
Summary of Rebuttal Satellite and surface temperature records and sea surface temperatures show that both the East Antarctic Ice Sheet and the West Antarctic Ice Sheet are cooling, not warming and glacial ice is increasing, not melting. Satellite and surface temperature measurements of the southern polar area show no warming over the past 37 years. Growth of the Antarctic ice sheets means sea level rise is not being caused by melting of polar ice and, in fact, is slightly lowering the rate of rise. Satellite Antarctic temperature records show 0.02C/decade cooling since 1979. The Southern Ocean around Antarctica has been getting sharply colder since 2006. Antarctic sea ice is increasing, reaching all-time highs. Surface temperatures at 13 stations show the Antarctic Peninsula has been sharply cooling since 2000.
 Claim #9: Rising atmospheric CO2 concentrations are causing ocean acidification, which is catastrophically harming marine life
Summary of Rebuttal As the air’s CO2 content rises in response to ever-increasing anthropogenic CO2 emissions, more and more carbon dioxide is expected to dissolve into the surface waters of the world’s oceans, which dissolution is projected to cause a 0.3 to 0.7 pH unit decline in the planet’s oceanic waters by the year 2300.
The ocean chemistry aspect of the ocean acidification hypothesis is rather straightforward, but it is not as solid as it is often claimed to be. For one thing, the work of a number of respected scientists suggests that the drop in oceanic pH will not be nearly as great as the IPCC and others predict. And, as with all phenomena involving living organisms, the introduction of life into the analysis greatly complicates things. When a number of interrelated biological phenomena are considered, it becomes much more difficult, if not impossible, to draw such sweeping negative conclusions about the reaction of marine organisms to ocean acidification. Quite to the contrary, when life is considered, ocean acidification is often found to be a non-problem, or even a benefit. And in this regard, numerous scientific studies have demonstrated the robustness of multiple marine plant and animal species to ocean acidification—when they are properly performed under realistic experimental conditions.

Graph
showing a typical oceanic situation. Over a 60 day period, pH fluxes
are far greater than claims of global shifts toward 7 (neutral) or lower
(acidity).
Summary of Rebuttal The term “carbon pollution” is a deliberate, ambiguous, disingenuous term, designed to mislead people into thinking carbon dioxide is pollution. It is used by the environmentalists to confuse the environmental impacts of CO2 emissions with the impact of the emissions of unwanted waste products of combustion. The burning of carbon-based fuels (fossil fuels – coal, oil, natural gas – and biofuels and biomass) converts the carbon in the fuels to carbon dioxide (CO2), which is an odorless invisible gas that is plant food and it is essential to life on the planet.

VOC refers to “volatile organic compounds” meaning any compound of
carbon produced from burning fuels, excluding carbon monoxide and carbon
dioxide.


No comments:
Post a Comment