State Fiscal Rankings
Ranking the States by Fiscal Condition 2017 Edition
All States

The
fiscal health of America’s states affects all its citizens. Indicators
of fiscal health come in a variety of forms—from a state’s ability to
attract businesses and how much it taxes to what services it provides
and how well it keeps its promises to public-sector employees. To get a
sense of a particular state’s fiscal outlook requires consulting a
state’s comprehensive annual financial report (CAFR), which, at hundreds
of pages, is unwieldy for even the most dedicated analyst. But in the
Mercatus Center at George Mason University’s “Ranking the States by
Fiscal Condition,” now in its fourth year, Eileen Norcross and Olivia
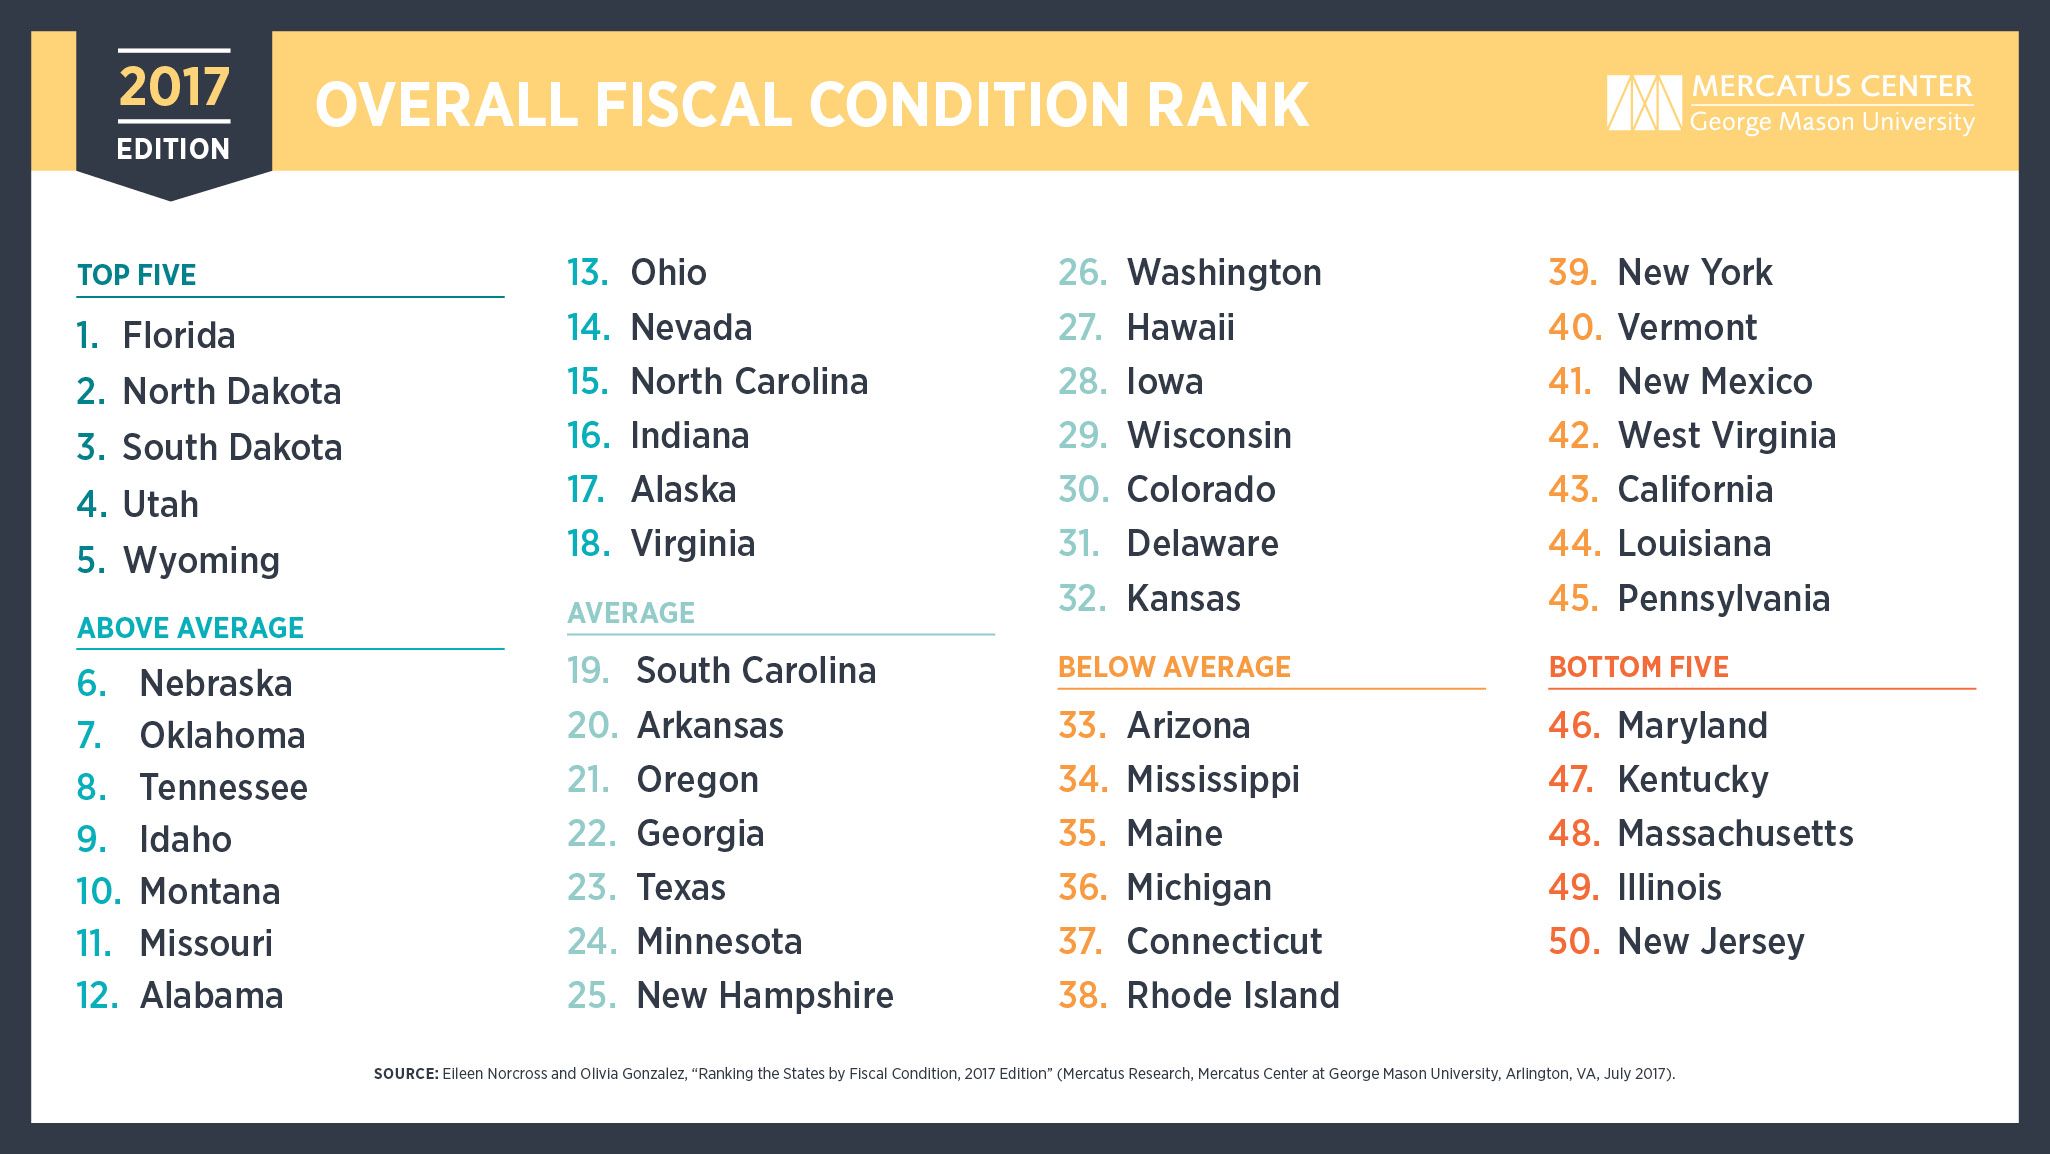
Gonzalez calculate indicators of fiscal health for all 50 states. Based
on states’ 2015 financial statements, Florida ranks first as the most
fiscally healthy state, while New Jersey ranks the lowest.
The study ranks each US state’s financial health based on short- and long-term debt and other key fiscal obligations, such as unfunded pensions and healthcare benefits. With refinements in its methodology, the 2017 edition updates the version that the Mercatus Center published in 2016. It presents information from each state’s audited financial report in an easily accessible format and is the most comprehensive snapshot of state financial health to date.
Providing the fourth year of data, this edition develops trend lines that help identify structural strengths and weaknesses for each state. Growing long-term obligations for pensions and healthcare benefits continue to strain the finances of many state governments, and revenue drawn from volatile sources like oil production continues to threaten the fiscal health of top-performing states. Both trends highlight the fact that state policymakers must be vigilant to consider both the short-term and the long-term consequences of their decisions.
The study also highlights how recent changes in accounting standards affect what states reveal on their financial statements and what we know about the states’ financial health as a result. Due to the implementation of new government accounting standards, states are now reporting more of their pension liabilities on the balance sheet, which increases the average long-term liability metrics for the states. States have not applied these standards consistently, however, revealing that there is still room for improvement in the reporting of state financial information.
This ranking of the 50 states, reproduced from page 29 of the study, is based on their fiscal solvency in five separate categories:
There were many more fluctuations in overall fiscal performance this year, compared to last year’s edition. Alaska, Colorado, Louisiana, New Mexico, Pennsylvania, and Texas all dropped significantly in the overall ranking of fiscal condition, while Arkansas, Connecticut, Delaware, Hawaii, Maine, North Carolina, and Oregon improved significantly.
There were also big movers in each of the five categories that make up the overall ranking:
The lessons from this year’s study demonstrate that policymakers should take stock of both their short- and longtermfiscal health before making public policy decisions. The quality of financial reporting also plays a large role in what is known about the states’ fiscal health. This report attempts to make available financial information more accessible while also stressing the importance of improved reporting. These metrics, when used alongside other information, are intended to help policymakers identify trends in state finances and respond with policies to ensure short-run solvency and long-run fiscal stability.
The study ranks each US state’s financial health based on short- and long-term debt and other key fiscal obligations, such as unfunded pensions and healthcare benefits. With refinements in its methodology, the 2017 edition updates the version that the Mercatus Center published in 2016. It presents information from each state’s audited financial report in an easily accessible format and is the most comprehensive snapshot of state financial health to date.
Providing the fourth year of data, this edition develops trend lines that help identify structural strengths and weaknesses for each state. Growing long-term obligations for pensions and healthcare benefits continue to strain the finances of many state governments, and revenue drawn from volatile sources like oil production continues to threaten the fiscal health of top-performing states. Both trends highlight the fact that state policymakers must be vigilant to consider both the short-term and the long-term consequences of their decisions.
The study also highlights how recent changes in accounting standards affect what states reveal on their financial statements and what we know about the states’ financial health as a result. Due to the implementation of new government accounting standards, states are now reporting more of their pension liabilities on the balance sheet, which increases the average long-term liability metrics for the states. States have not applied these standards consistently, however, revealing that there is still room for improvement in the reporting of state financial information.
Summary and Key Findings
The financial health of each state can be analyzed through the states’ own audited financial reports. By looking at states’ basic financial statistics on revenues, expenditures, cash, assets, liabilities, and debt, states may be ranked according to how easily they will be able to cover short-term and long-term bills, including pension obligations.This ranking of the 50 states, reproduced from page 29 of the study, is based on their fiscal solvency in five separate categories:
- Cash solvency. Does a state have enough cash on hand to cover its short-term bills?
- Budget solvency. Can a state cover its fiscal year spending with current revenues, or does it have a budget shortfall?
- Long-run solvency. Can a state meet its long-term spending commitments? Will there be enough money to cushion it from economic shocks or other long-term fiscal risks?
- Service-level solvency. How much “fiscal slack” does a state have to increase spending if citizens demand more services?
- Trust fund solvency. How large are each state’s unfunded pension and healthcare liabilities?
Top Five States
Florida, North Dakota, South Dakota, Utah, and Wyoming rank in the top five states. Top-performing states tend to have higher levels of cash, low unfunded pensions, and strong operating positions.- Low debt and a strong cash position help maintain fiscal discipline. Keeping debt levels low, saving cash to pay bills, and maintaining solvent budgets reflect a culture of fiscal discipline. The first-place position of Florida in particular demonstrates that this is possible even with a relatively larger population and and the fiscal pressures that arise from an aging population.
- Oil and gas revenues play a role in short-term fiscal health. The top-performing states owe some of their success to unpredictable revenue sources. As oil prices have been declining, however, we see this detrimentally affecting their budgets. Alaska has moved out of the top five, and Wyoming has moved from third to fifth as a result. North Dakota’s revenues also declined and have the potential to impact their future rankings.
- Pensions and health care still pose long-term challenges to top-performing states. While these top five states are considered fiscally healthy relative to other states because they have significant amounts of cash on hand and relatively low short-term debt obligations, each state, especially Wyoming, faces substantial long-term challenges related to its pension and healthcare benefits systems.
- The top five states have changed since last year. Alaska and Nebraska dropped out of the top five, allowing Florida and Utah to join. North Dakota and South Dakota improved from fourth and fifth to second and third, respectively, pushing Wyoming down two spots to fifth place.
Bottom Five States
Maryland, Kentucky, Massachusetts, Illinois, and New Jersey rank in the bottom five states, largely a result of the low amounts of cash they have on hand and their large debt obligations. States that fail to address long-term drivers of debt and are not prepared for recessions will continue to rank poorly.- Each state has massive debt obligations. Each of the bottom five states exhibits serious signs of fiscal distress. Their large liabilities and low cash on hand raise serious concerns about their ability to pay bills.
- Unfunded liabilities continue to be a problem. High deficits and debt obligations in the forms of unfunded pensions and healthcare benefits continue to drive each state into fiscal peril. Each holds tens, if not hundreds, of billions of dollars in unfunded liabilities—constituting a significant risk to taxpayers in both the short and the long term.
- The bottom five states have changed since last year. Kentucky’s position has declined, placing it in the bottom five this year. New York is no longer in the bottom five due to improvements in budget solvency. Illinois and New Jersey improved slightly but remain in the bottom five. Massachusetts also remains in the bottom five, in slightly worse positions than last year.
Big Movers
To be considered a “big mover,” a state must have shifted position by more than five spots between the 2016 and 2017 editions. The major drivers of fiscal performance for states this year were the implementation of new accounting standards that require the reporting of pension liabilities on the balance sheet, a steep drop in the price of oil, changes in tax policy, and budget cuts.There were many more fluctuations in overall fiscal performance this year, compared to last year’s edition. Alaska, Colorado, Louisiana, New Mexico, Pennsylvania, and Texas all dropped significantly in the overall ranking of fiscal condition, while Arkansas, Connecticut, Delaware, Hawaii, Maine, North Carolina, and Oregon improved significantly.
There were also big movers in each of the five categories that make up the overall ranking:
- Cash solvency. Hawaii, North Carolina, and Oregon improved their cash solvency ranking.
- Budget solvency. Arkansas, California, Connecticut, Hawaii, Indiana, Kentucky, Maine, Maryland, Missouri, New York, Oklahoma, Rhode Island, Tennessee, and Vermont all improved their budget position significantly. Alabama, Alaska, Colorado, Iowa, Kansas, Mississippi, Nebraska, New Mexico, Ohio, South Carolina, Texas, Washington, and Wisconsin worsened in the budget solvency ranking.
- Long-run solvency. Florida, North Carolina, Oregon, Virginia, and Wisconsin each improved their long-run solvency ranking. Colorado, Maine, Indiana, Vermont, and West Virginia dropped in this area.
- Service-level solvency. Alaska and Wisconsin improved significantly in the service-level solvency ranking, while Arizona and Iowa worsened.
- Trust fund solvency. Only North Dakota improved significantly, while Oregon, Vermont, and Wyoming each dropped in the trust fund solvency ranking.
Conclusion
Updating the fiscal condition of the states with another year of data shows that drivers of strong fiscal performance remain the same. Top-performing states tend to exhibit fiscal discipline in the form of having high levels of cash, maintaining revenues that exceed expenses, and keeping debt levels low relative to resident income. These factors can easily be threatened if a state relies too heavily on narrow tax bases and volatile revenue sources or if pension plans are not adequately funded, leading to persistently large and growing liabilities.The lessons from this year’s study demonstrate that policymakers should take stock of both their short- and longtermfiscal health before making public policy decisions. The quality of financial reporting also plays a large role in what is known about the states’ fiscal health. This report attempts to make available financial information more accessible while also stressing the importance of improved reporting. These metrics, when used alongside other information, are intended to help policymakers identify trends in state finances and respond with policies to ensure short-run solvency and long-run fiscal stability.

No comments:
Post a Comment