Climate Change: Incoming Sunlight
Tuesday, September 1, 2009
Scientists
sometimes describe Earth's climate as if it were a machine - a complex
system with different cycles that move energy and matter around the
planet. For example, the climate system has a water cycle, a carbon
cycle and an energy cycle. In this analogy, the Sun is the main source
of power for the machine, exceeding the next largest source by almost
10,000 times.
The Sun's rays warm our world, stir air and ocean
currents, and catalyze chemical reactions in the atmosphere. The
Sun-warmed surface evaporates water to form rainclouds that redistribute
fresh water around the world. And sunlight is essential for most life
forms that live at Earth's surface. Along with heating Earth, the Sun
provides energy directly to plants through photosynthesis, and
indirectly to animals and organisms that eat plants.
If Earth had no atmosphere and we had to rely upon the
Sun's energy alone, Earth would be a frigid place. Its mean global
temperature would be about 0°F. In comparison, if Earth was shrunk to
the size of a basketball its atmosphere would be about as thick as a
sheet of plastic wrap. Still, our relatively thin blanket of atmosphere
is enough to dramatically slow the rate at which heat escapes to space.
Specifically, heat-trapping gases in the atmosphere absorb and then
re-radiate downward some of the heat given off by the surface and lower
atmosphere. With this additional warming - known as the "greenhouse
effect" - Earth's mean surface temperature is a comfortable 59°F.
Explore this interactive graph:
Click and drag to display different parts of the graph. To squeeze or
stretch the graph in either direction, hold the shift key on your
keyboard as you click and drag. The graph shows the amount of sunlight
entering the top of Earth's atmosphere from 1610 to 2010. Scientists
call this quantity "total solar irradiance," shown here in Watts per
square meter (W/m2). Space-based measurements, begun in 1978, indicate Earth receives an average of 1,361 W/m2 of incoming sunlight, an amount that has varied in the recent past by about 1 W/m2
(or one-tenth of one percent) on roughly 11-year cycles. Data courtesy
of Greg Kopp, Laboratory for Atmospheric and Space Physics, University
of Colorado; and Judith Lean, Space Science Division, Naval Research
Laboratory.
The climate system's sensitivity to incoming and
outgoing radiation is why scientists are so keenly interested in
measuring how much energy comes from the Sun on an ongoing basis.
Increases in the Sun's output are typically associated with times of
higher solar activity when many small dark patches - sunspots - appear
like freckles on the face of the Sun. "Small" is relative, of course, as
many sunspots are larger than our entire planet! Sunspots are cooler
than the surrounding solar surface (if you can call 7000°F "cool"!),
making them appear dark. Though sunspots send less light toward Earth,
they are typically surrounded by brighter areas, called faculae, which
are a few percent brighter than the average Sun. Observations through
several solar cycles reveal that the overall increase in brightness of
faculae overpowers the sunspot darkening so that the combined effect of
the two causes an increase of about 1 Watt per square meter in incoming
sunlight. The 11-year cycle of slight brightening and dimming can be
seen in the graph above.
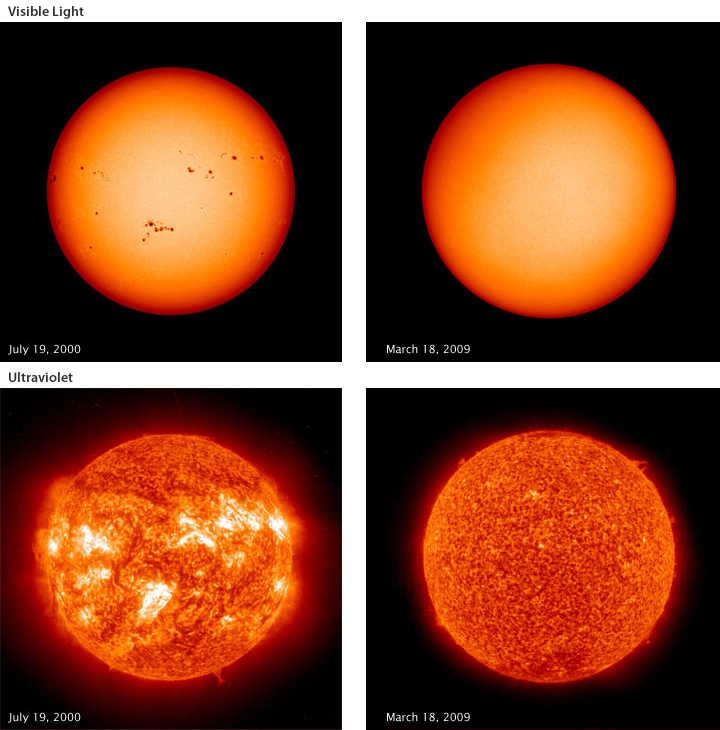
Instruments
on the Solar and Heliospheric Observatory (SOHO) spacecraft allow
scientists to make pictures of the Sun using different wavelengths of
light. In the top pair of images, the Sun’s surface is seen in visible
wavelengths during a period of high solar activity when sunspots are
numerous (left), and during the low activity, when there are few
sunspots (right). The bottom pair of images was acquired at much shorter
wavelengths — in the extreme ultraviolet part of the spectrum — to show
energy from the hotter atmosphere above the Sun’s surface. At these
layers the temperature is about 60,000 Kelvin, which is ten times hotter
than the surface of the Sun. In the lefthand image, the very bright
patches associated with surface activity are called “plage.” They’re
typically seen above faculae and occur often during periods of solar
maximum when the Sun’s energy output is highest. The image on the right
shows the Sun during a period of solar minimum. Image courtesy SOHO, EIT
Consortium, and the MDI Team.
Luckily for us, the amount of energy that the Sun sends
to Earth's surface is relatively stable. But this amount of energy is so
large that even small fluctuations in the Sun's output may cause
significant climate change. For example, evidence suggests that the
period of global cooling, known as the "Little Ice Age" (circa
1600-1850), may have been caused in part by a decrease in the Sun's
energy output. During one 30-year stretch in the 1600s - the coldest
period of the Little Ice Age when winter temperatures in Europe were
from 1 to 1.5°C (1.8-2.7°F) colder than average - astronomers observed a
total of only 50 sunspots, indicating a very quiet Sun. In contrast,
the Sun has been more active in recent decades, displaying 160 sunspots
or more in one 11-year cycle alone. Based on sunspot records and other
proxy datasets, scientists believe that the Sun's energy output
increased slightly between 1900 and 2000.
In 1978, scientists began making the space-based
measurements of total solar irradiance needed to understand the Sun's
influence on Earth's climate. Space-based measurements are crucial for
measuring the Sun's signal undistorted by the thick soup of gases and
particles in our atmosphere. Before 1978, the Sun's brightness was
generally considered to be constant. Measurements obtained over the past
33 years have helped scientists characterize solar irradiance changes
and resulting changes in Earth's temperature. While incoming sunlight
may have increased slightly over the last century, this increase
accounts for less than 10 percent of the warming our world experienced
over that time. Thus, the increase in total solar irradiance alone
cannot account for all of the global warming observed since 1900.
Scientists don't yet understand the full range of
variance in energy output that the Sun is capable of. So it's crucial
that scientists continue monitoring total solar irradiance as an
important part NOAA's overall effort to advance scientific understanding
of the Sun and Earth's climate system, and to provide beneficial
services for society, such as early warnings whenever solar storms are
directed at Earth.
Further ReadingA Primer on Space Weather. NOAA Space Weather Prediction Center. Accessed February 26, 2010.
Scott, Michon. 2009. Sunspots at Solar Maximum and Minimum. NASA Earth Observatory. Accessed March 20, 2009.
Lindsey, Rebecca. 2003. Under a Variable Sun. NASA Earth Observatory. Accessed March 17, 2009.
References
Kopp, G. and Lean, J.L. 2011. A New, Lower Value of Total Solar Irradiance: Evidence and Climate Significance, Geophys. Res. Letters, Frontier Articles. Vol 38, L01706, doi:10.1029/2010GL045777.
Lean, Judith L. 2010. Cycles and trends in solar irradiance and climate. Wiley Interdisciplinary Reviews: Climate Change. Vol 1, Issue 1. pp 111-122. Dec 22, 2009. doi:10.1002/wcc.018.
Lean, Judith L. and David H. Rind. 2009. How will Earth's surface temperature change in future decades? Geophysical Research Letters. 36, L15708, doi:10.1029/2009GL038932.
Lean, Judith L. and David H. Rind. 2008. How natural and anthropogenic influences alter global and regional temperatures: 1889 to 2006. Geophysical Research Letters. 35, L18701, doi:10.1029/2008GL034864.
Kopp, G., Lawrence, G., and Rottman, G. 2005. "The Total Irradiance Monitor (TIM): Science Results," Solar Physics, 230, 1, pp. 129-140.
Muscheler, Raimund, F. Joos, S.A. Muller, I. Snowball. 2005. "How unusual is today's solar activity?" Nature, v436, pp. E3-E4. (With reply by Solanki et al.)
Wang, Y.-M., J.L. Lean, and N.R. Sheeley, Jr. 2005. "Modeling the Sun's Magnetic Field and Irradiance Since 1713," The Astrophysical Journal, v625, pp. 522-38.

No comments:
Post a Comment